Gindo Tampubolon, Lecturer in Poverty, Global Development Institute
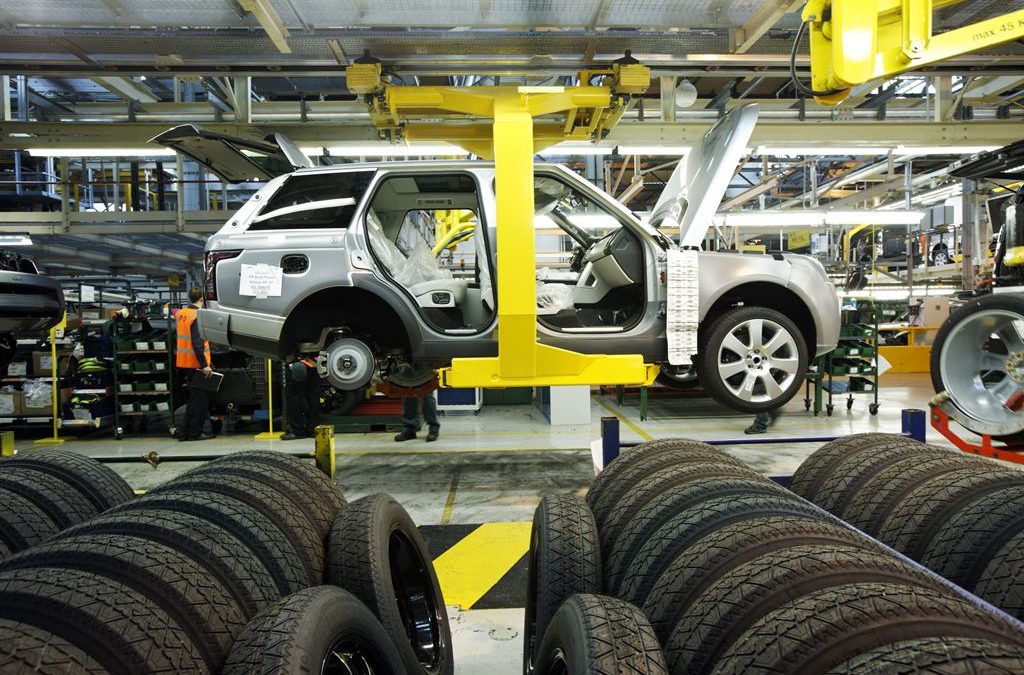
A short BBC video on How cars are made opens up a view to global production networks traversing the world today. Honda automobile plant in Swindon (Britain) imported alloy wheels for its cars from Ghent (Belgium), delivered in just 8 hours! With tens of thousands other parts assembled into a car, each imported alloy wheel will roll out of Swindon and most likely be exported across the Channel to a third European country. Hondas and other cars assembled in Britain are apt to be found in forecourts and showrooms across Europe.
The production of cars and most goods today, from trousers to smartphones in their pockets, are unlikely wholly made in one place. Production networks are global. These networks make measuring value added in global production not entirely straightforward. Not all the value of automotive export from Honda’s Swindon plant should be assigned to Britain; some should be assigned to Belgium and other countries making the other parts. With tens of thousands of parts involved, opportunities for double-counting abound.
To take another example. Large pharmaceutical firms in Britain, Sweden and US routinely monitor how their markets are segmented around the world and within countries. They commission studies to consulting firms in London and Manchester. This commission involves design of discrete choice experiments in Manchester, to be deployed across the globe where the drugs are sold. The resulting data are cleaned and prepared, sometimes in India, Indonesia and Oman. Data analytics, informed by the earlier design, is performed in Manchester. Occasional teleconferences brought clinical consultants, analytics experts and clients across the Channel and even across the Atlantic. The final consulting report to be delivered to pharmaceutical offices around the world is drafted in London or Manchester.
Under this complex production networks, many policies and strategies will be misplaced if evidence rested on import-export statistics and not on value added statistics. It is critical therefore to determine how much value added a country can claim, based on global import-export statistics or input-output matrix. Carefully decomposing values to the various terms (value added or double counted?) and assigned them to the constituent nodes in the network across the globe (Britain or Belgium?) is non-trivial. For instance, the term for double counting (when not careful, alloy wheels risk being counted and claimed twice by the two nodes in the network, Belgium and Britain). What is certainly desired is the term for foreign-sourced value added: the added value to the assembled car by virtue of the fact that it has alloy wheels (sourced from British foreign partners) that are assembled into a final product (a car) by British workers; this is rightly claimed by Britain. Doing this exercise for all goods and services produced around the world is taxing.
But the exercise is now made easier by recent techniques of decomposition (RC Johnson 2017. Measuring Global Value Chains. Annual Review of Economics; A Borin and M Mancini 2017. Follow the value added: Tracking bilateral relations in global value chains. MPRA paper 82692). I computed foreign-sourced value added using Borin-Mancini decomposition and draw the global value added network. The relative placement of nodes and the size of edges are informative. Each pair of nodes or countries is placed proportional to their trade in value added. The amount of a country’s value added contained in her export to a partner is proportional to the size of the arrow from her to the partner.
Here is a global value added network from 2002 and 2014. The relative placement of nodes is made according to the algorithm of Fruchterman and Reingold which captures the physical force binding the partners. The more they trade together, the closer they are visually. Value added computation is done in Stata using Borin and Mancini’s code; visualisation is done in R using Gabor Csardi igraph package. At a glance, the network gives relative importance of a country in the constellation of her trading partners. Neatly, it also indicates evolution of such constellation and positions, as we’ll see.
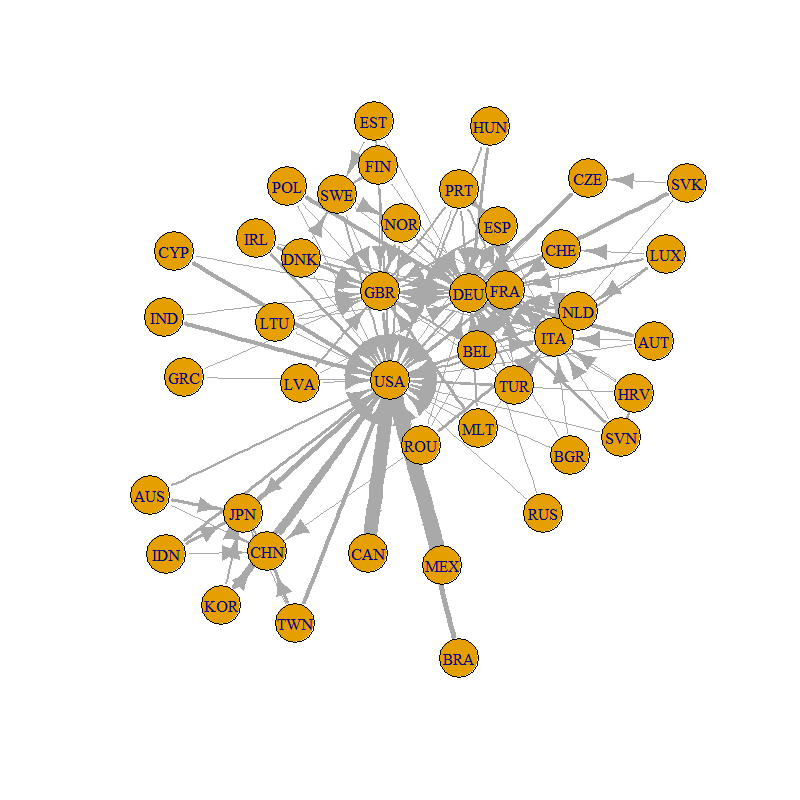
Global production network 2002, Borin and Mancini decomposition of value added in global import export matrix. Source: Global Input Output database, www.wiod.org
In 2002 the triangle of US, Britain (GBR) and Germany (DEU) make up the core of global value added sub-network in the upper part of the network. This attests to the role of Germany and, to a lesser extent, Britain in Factory Europe. Separately, China (CHN) and Japan (JPN) clearly carved out another sub-network in the lower part of the network.
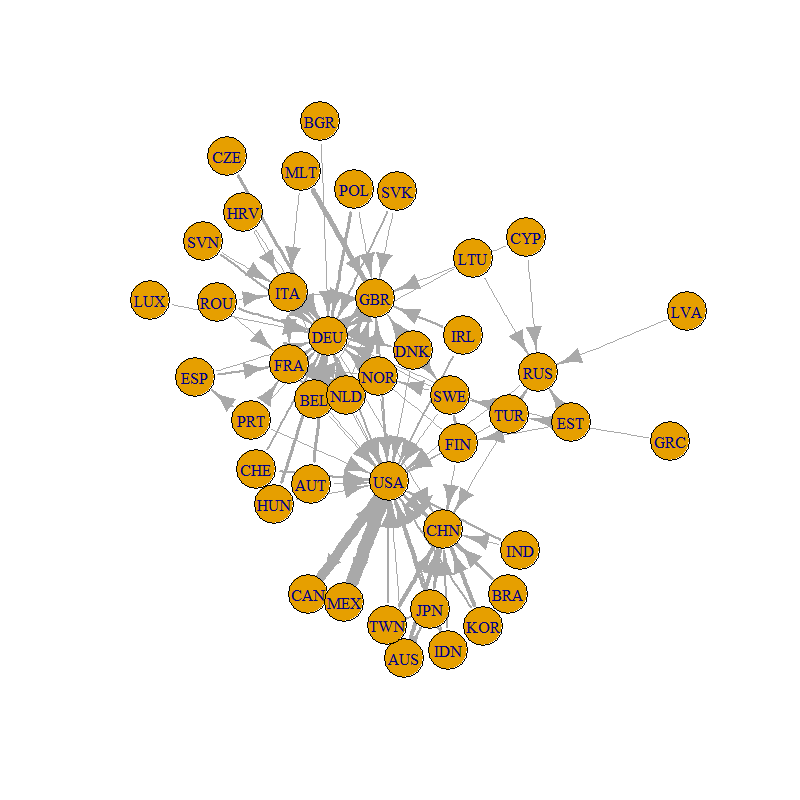
Global production network 2014, Borin and Mancini decomposition of value added in global import export matrix. Source: Global Input Output database, www.wiod.org
But things have changed. The passing decade witnessed a clear formation of a multipolar global value added network with unique roles for Germany, US and China. Moreover there is a distinct hierarchy to the current global value added network, with Europe-oriented in the north part of the network, US-oriented in the middle, and China-oriented in the lower part. In turn these three poles trade heavily with each other. In future it is important to monitor the global value added network once Britain unmoored herself from Europe. Will it float adrift or latch on to one of the other poles?