The Hrishipara Daily Diary Project tracks the daily money transactions of households in central Bangladesh. This is the third in our series ‘Tracking Transactions, Understanding Lives’, which focuses on individual diarists, creating pictures that give a sense of what these lives are like.
Managing income volatility: Ubaydullah, the brick-breaker
We have been tracking Ubaydullah’s 5-person household since mid-August 2015. His income varies a lot from month to month, so how does he manage such volatility? Chart 1 sets the scene.
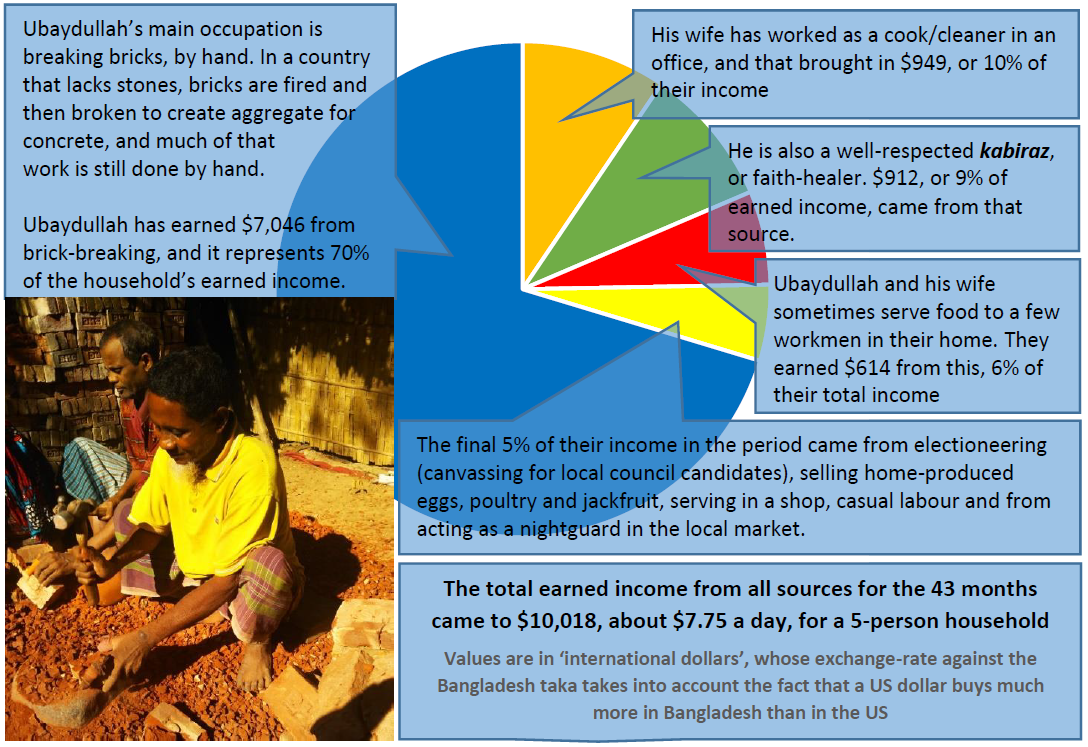
Chart 1: composition of Ubaydullah’s household’s earned income September 2015 to February 2019, in international $
Our second chart shows how these earnings are distributed over time. He earned from brick-breaking (dark blue) every month, but from faith-healing (green) more sporadically. His wife stopped working in the office (gold) by the spring of 2017 and turned to cooking (red). The night-guarding began in February 2019 when the Market Committee decided to charge each shopkeeper 14 cents a day to fund a guard, and Ubaydullah got the job. The other sources of income are scattered across the period, with none of them bringing in consistent income.
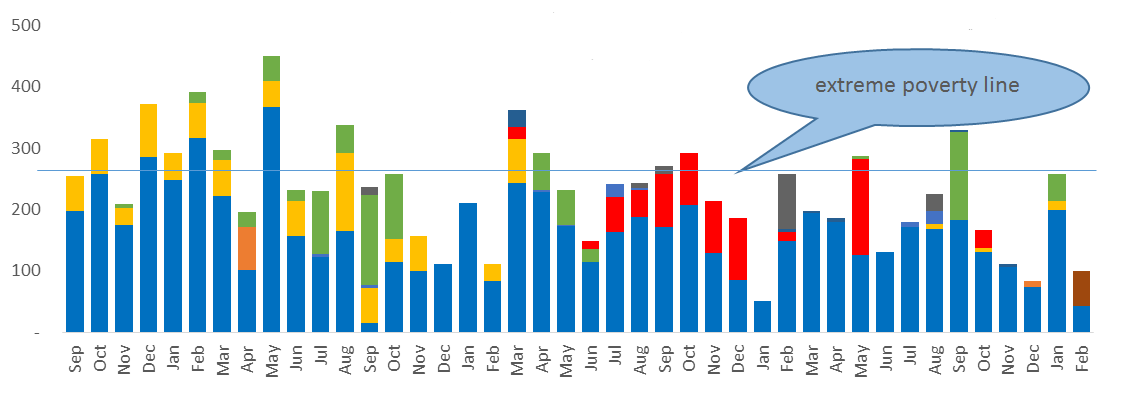
Chart 2: monthly composition of Ubaydullah’s income, September 2015 to February 2019, international $s
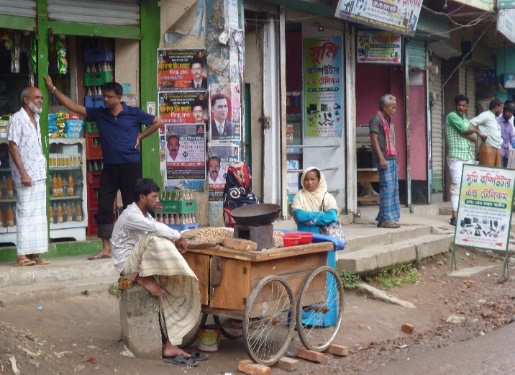
The market that Ubaydullah now guards each night: photo Stuart Rutherford
Coping with volatility
Chart 2 shows how variable their income is. In January 2018 only $51.43 came in, while $450 came in in May 2017. So one month they lived on 34 cents per person per day, far below the ‘extreme poverty’ benchmark for income, and another month they lived on $3 per person per day, lifting them clear of such extreme poverty.
How does the household cope with this income volatility that tosses them in and out of extreme poverty? Ubaydullah told us that he copes psychologically by simply not caring. “I’m a cheerful fellow. I never worry”, he said. When we asked him what he thinks about when he’s breaking bricks all day he smiled and said “Mostly nothing. Though sometimes I daydream about building a new house for my son to live in”. They skip meals occasionally but he says they don’t suffer much from that. He did admit, though, that things hadn’t been good recently (as we see from the downward-sloping trendline of his income as shown in Chart 3, below) and that’s why he was so keen to get the night-guarding job, which should earn him $171 a month.
Our transaction records help to answer another question: ‘how do they cope in terms of money-management?’ Chart 3 summarises the income shown in Chart 2 but adds his saving and borrowing.
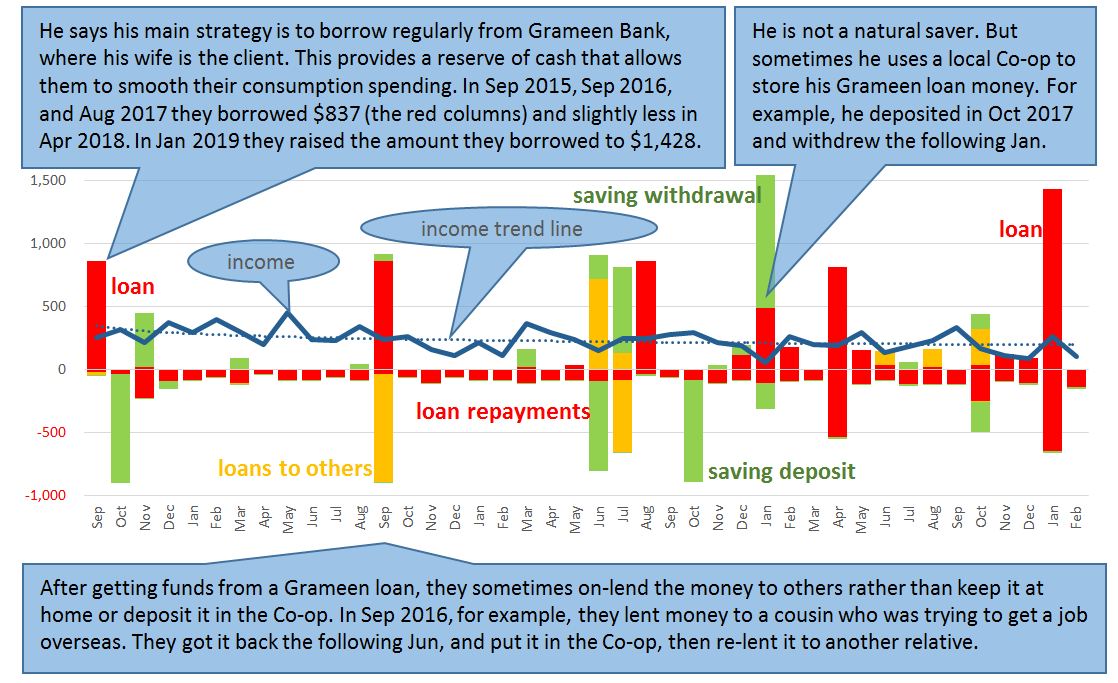
Chart 3: Ubaydullah’s total monthly income (shown by the line), and his savings and borrowing behaviour (shown by the columns) monthly, international $s
There are some puzzles in Chart 3. Ubaydullah claims to be a care-free non-worrying type, yet he pays quite heavily to maintain cash reserves by taking Grameen loans at an interest rate of around 22% a year. Perhaps he doesn’t worry precisely because he takes such precautions. But then, in September 2016 he took a Grameen loan and immediately lent the whole of it to a cousin, rendering it unavailable for consumption-smoothing. And he doesn’t in fact hold much in the way of reserves: the $1,000 he withdrew in January 2018 was exceptional – it is the biggest sum we have ever seen them hold in their savings accounts at Grameen and at the Co-op. In our weekly tracking of the amount of cash he holds at home we have never found him holding more than $104: it’s usually around $15 and on occasions as low as $2.
A tight rein on spending
Maybe his control of expenditure is the real key to how he manages. Our last chart takes a look.
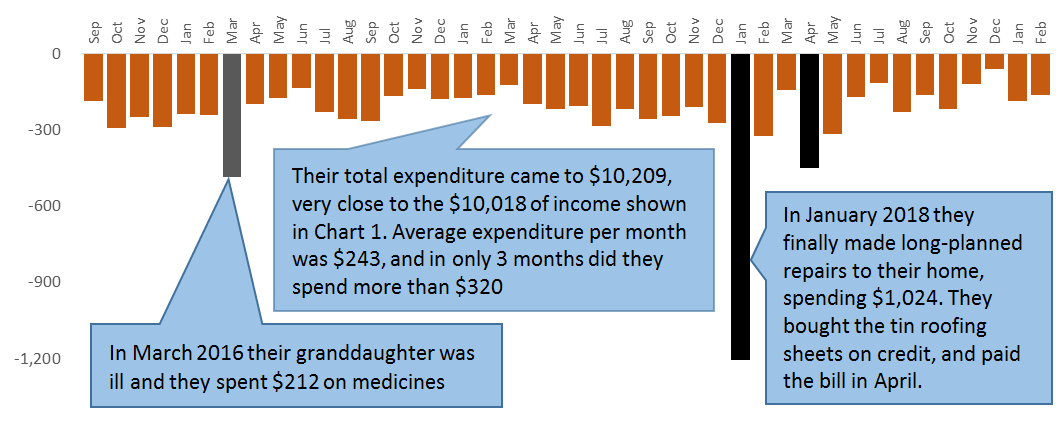
Chart 4: Ubaydullah’s total monthly expenditure monthly, international $s
Maybe they should be counted as lucky to have had only two exceptional needs to spend in the three and a half years we have tracked them. Two granddaughters and their divorced mother live with Ubaydullah and his wife and in March 2016 one of the girls was sick. Then in early 2018 they repaired their home, something they’d been putting off for years. As Chart 3 shows, the home repair was accompanied by borrowing and by withdrawing savings. Ubaydullah did most of the building work himself, which is why his earnings for January 2018 were so low (Chart 2).
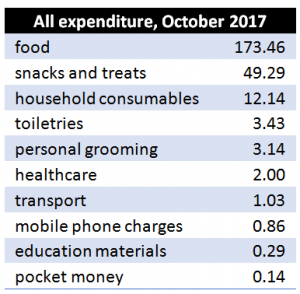
In most months their spending was very modest. In October 2017 they spend $245, very close to their average of $243, and we show the breakdown in the table alongside. Among the food items, $66 went on rice, and $13 on cooking oil. They ate chicken three times and fresh fish twice in the month. The ‘snacks and treats’ included a fruit drink for his wife, but mostly consisted of betel leaf and nut (a mild stimulant which also suppresses the appetite). He chews it while working (19 times, costing $21) or at the tea-stall after work (32 times, $27). They didn’t spend on any other entertainment, although Ubaydullah regards his occasional shave at the barber’s as a treat.
Stuart Rutherford
April 2019
During the time we have been tracking Ubaydullah, we have been supported for a year by CGAP and for two years by UNCDF, for which we are grateful. We are now funding the research from our own resources. Anyone willing to support this work can contact me at write.ser@gmail.com. Thank you.
Read more analysis based on the Hrishipara Diaries:
- Hrishipara daily financial diaries: Tracking transactions, understanding lives part 1
- How are Digital Financial Services used by poor people in Bangladesh?
- What the poor spend on health care?
- How the poor borrow?
- What do poor households spend their money on?
- Tracking the savings of poor households
- When poor households spend big
- When poor households spend big part 2
- Poverty measurement using data from the Hrishipara daily financial diaries
- Receiving Gifts in Low-Income Households