By Stuart Rutherford, Honorary Research Fellow at The Global Development Institute
The ongoing Hrishipara Daily Diary project records the daily money flows of 50 low-income households living near a market town in central Bangladesh. More details about the project, and about the relative poverty levels of the ‘diarists’ are given in another blog. 22 of the diarists – we call them the ‘extreme poor’ and the ‘very poor’ – have incomes below the ‘$2 a day per person PPP’ level. The 28 with higher incomes we categorise as ‘moderate poor’ and ‘near poor’.
The composition of total outflows
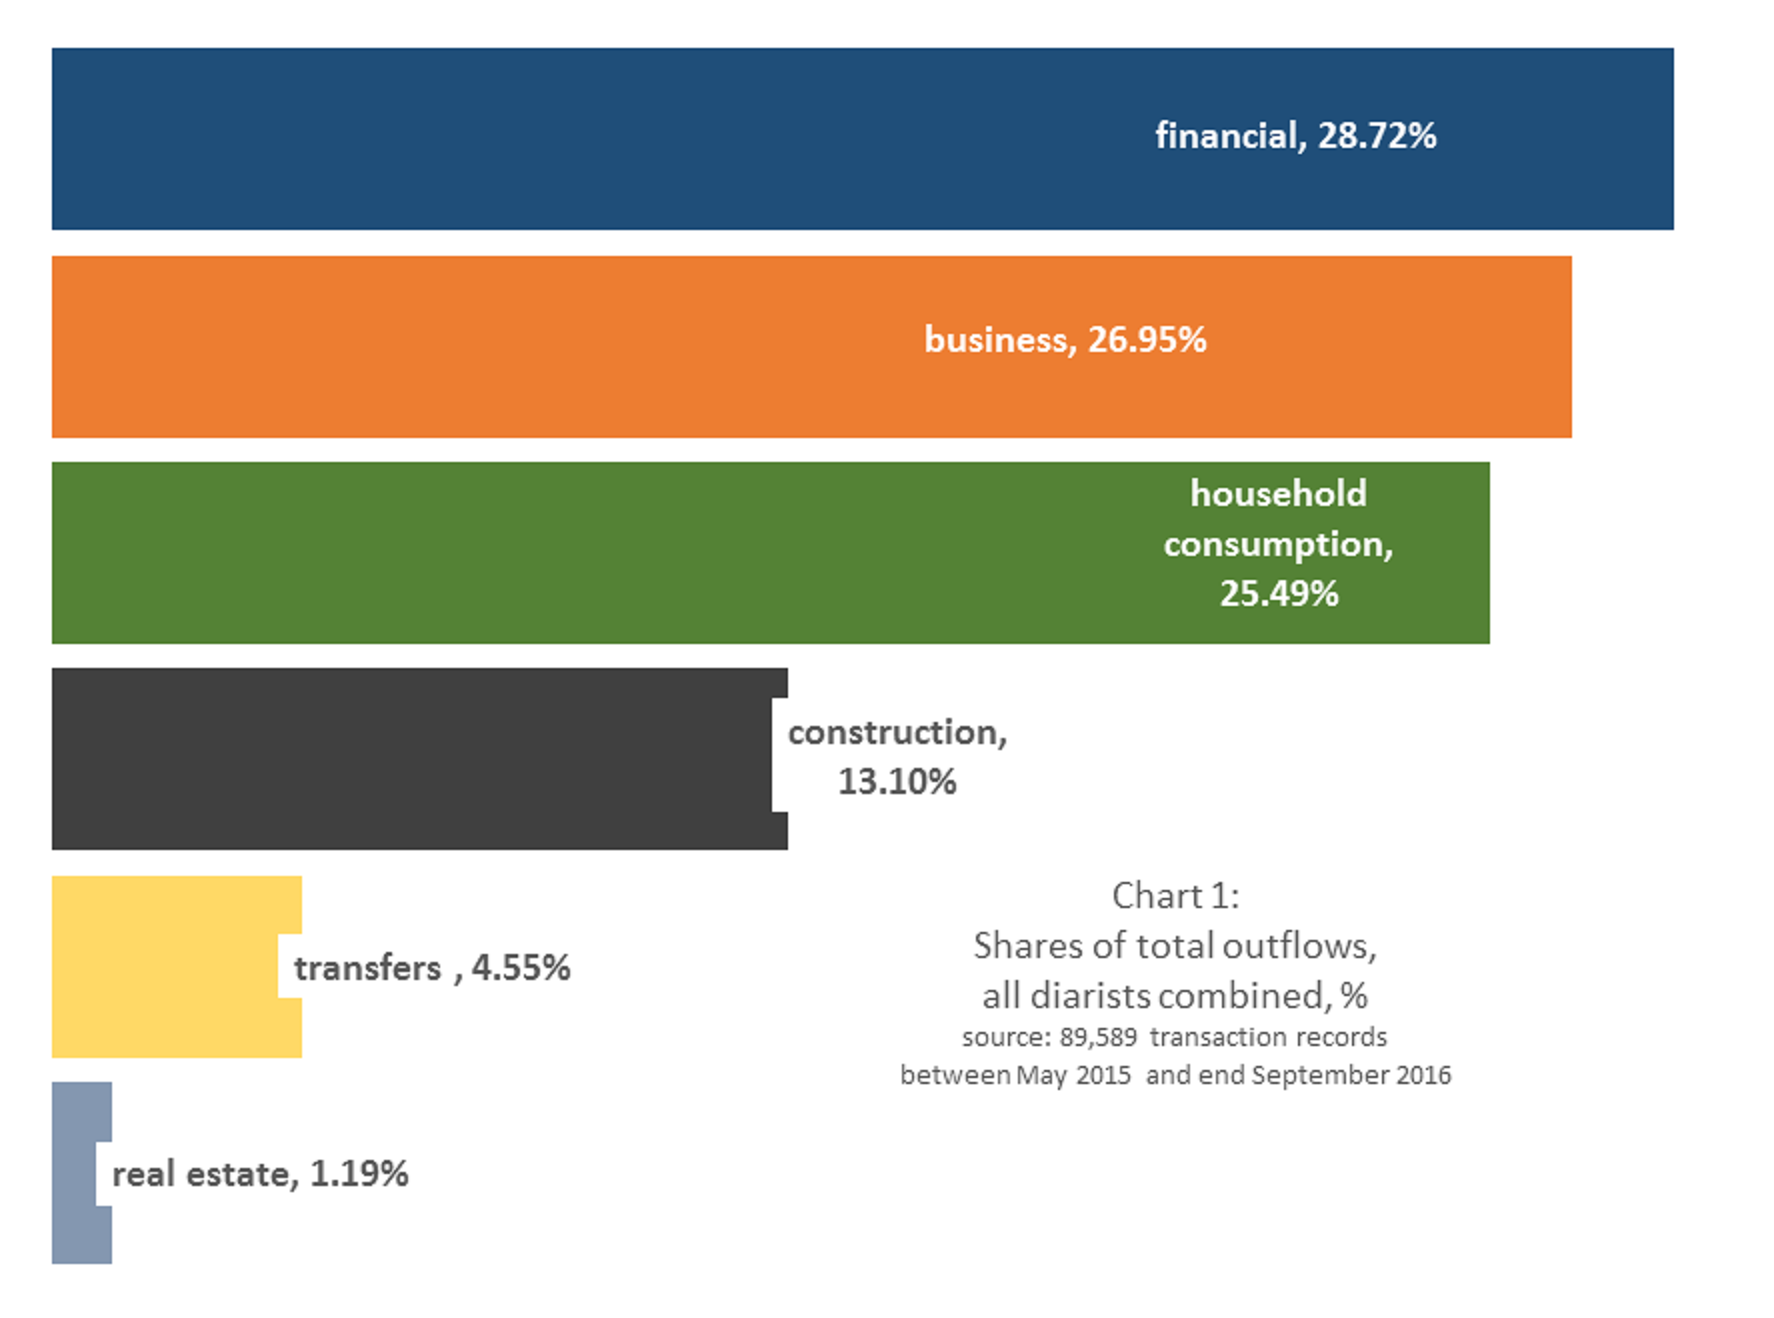
Our data collection records all the money that flows in and out of the diarists’ hands. We begin with a chart that shows the main categories of the total outflow.
 Financial outflow
The biggest single chunk of outflow is financial. It consists mainly of making savings and repaying loans, though some diarists give loans to others, or repay savings entrusted to them by others. Of these financial outlays, just over half are loan repayments, just over a third are saving deposits, and most of the remainder is accounted for by loans that diarists give to others.
That nearly 29% of total outflow went on financial flows is a significant finding. But just as inflows of loans and of savings withdrawals are not usually included in calculations of income, outflows of loan repayments and savings are not usually regarded as part of core expenditure. For this reason, we look in detail at financial outflows elsewhere.
Business outflow
As a percentage of all outflows of all diarists, the next biggest category is business expenditure. Among our diarists who have businesses, three run small general stores and their combined spending on buying stock for their shops accounts for more than half of all business outflow. Other retailers have stock-buying expenditure: two who sell snacks, one selling shoes, and a dressmaker. Some service providers also have business costs for materials and rents: we have a barber, a laundryman, a cycle repairer and a garbage-recycler. Fifteen of our diarists are small-holder farmers, and their farm costs are included in this category. How business costs are financed is of interest, and will be explored in another blog. But because business costs are outlays needed to create income, rather than expenditure of income, we do not look at them in detail here.
Consumption outflow
The remaining four categories, representing about 56% of all outflows, are the consumption spending of our diarists. Just one diarist made a big investment in real-estate, buying a piece of farm land. But several of our better-off diarists, all of them from households receiving remittances from family members working abroad, spend heavily on building new homes, shown in the chart as the ‘construction’ category. ‘Transfers’ is money handed on by our diarist to other members of the household to spend: we can regard it as a sub-category of the ‘household consumption’ category.
Food: Our detailed analysis will focus on food. Food accounts for just 11% of total outflows (all the categories in chart 1). But it is 43% of the household consumption category. It is not just the biggest element in household consumption, it dwarfs all the others, as our second chart shows.
Within the food category, there are three leading items each with about a 20% share: meat, fruits & vegetables, and fish. Then comes rice (the staple) with a 14% share, and cooking oil with a 5% share.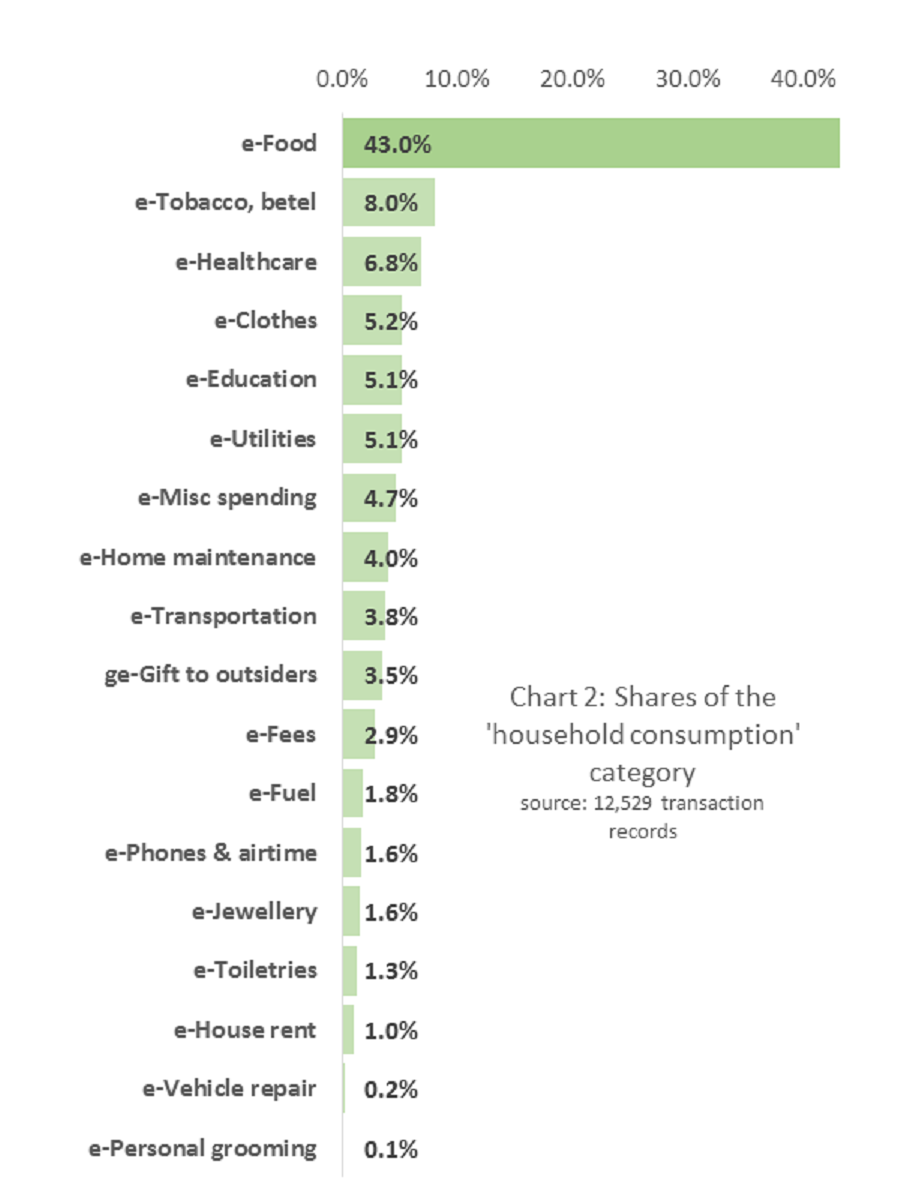
These results are for all 50 diarists, but 15 of them do some farming, and eat some of their own produce. Ignoring the farmers gives a clearer picture of the composition of food expenditure for those households who have to buy all their food.
If we leave out the 15 farmers, the share of total outflows that gets spent on food is not much changed. But the share of household consumption spent on food rises from 43% to 45%. Within the food sub-category, there is one notable, if expected, change: rice climbs up the ranking to third (after fruit & vegetables, and meat), with a share of just under 18% of all food spending.
So far we have taken no account of the relative wealth of our diarists. Our next exercise is to see what differences there may be in the share of expenditure devoted to food, or in the food items they choose to buy, between the poorest and wealthiest of our diarists. To do this, we compare 10 ‘extreme poor’ non-farmers, with a median per-person per-day income of PPP$1.21, with 10 ‘moderate poor’ and ‘near poor’ non-farmers with a median per-person daily income of PPP$4.62.
We start with the ten poorest non-farmers. For them, household consumption accounts for a much bigger proportion of all outflows than for the 50 diarists taken together: 40.1% (as opposed to 25.5% in chart 1). Financial outflows slip to second place, but their 31.5% is a bigger share than for the diarists as a whole. Part of the reason for these shifts is that their new home construction spending is near zero: they don’t build big new homes (though they do repair existing ones).
For these poor diarists, 55% of all household consumption is for food – a much bigger share than we saw in chart 2. Within that food sub-category, rice climbs to the top, with a big 28% share of food spending (even though several of these diarists buy government-subsidised rice). It is followed by fruits & vegetables (mostly vegetables, 25.5%), and fish (12.1%). Meat drops out of the top items altogether, falling below cooking oil (6.4%). Chart 3 shows some of these shares.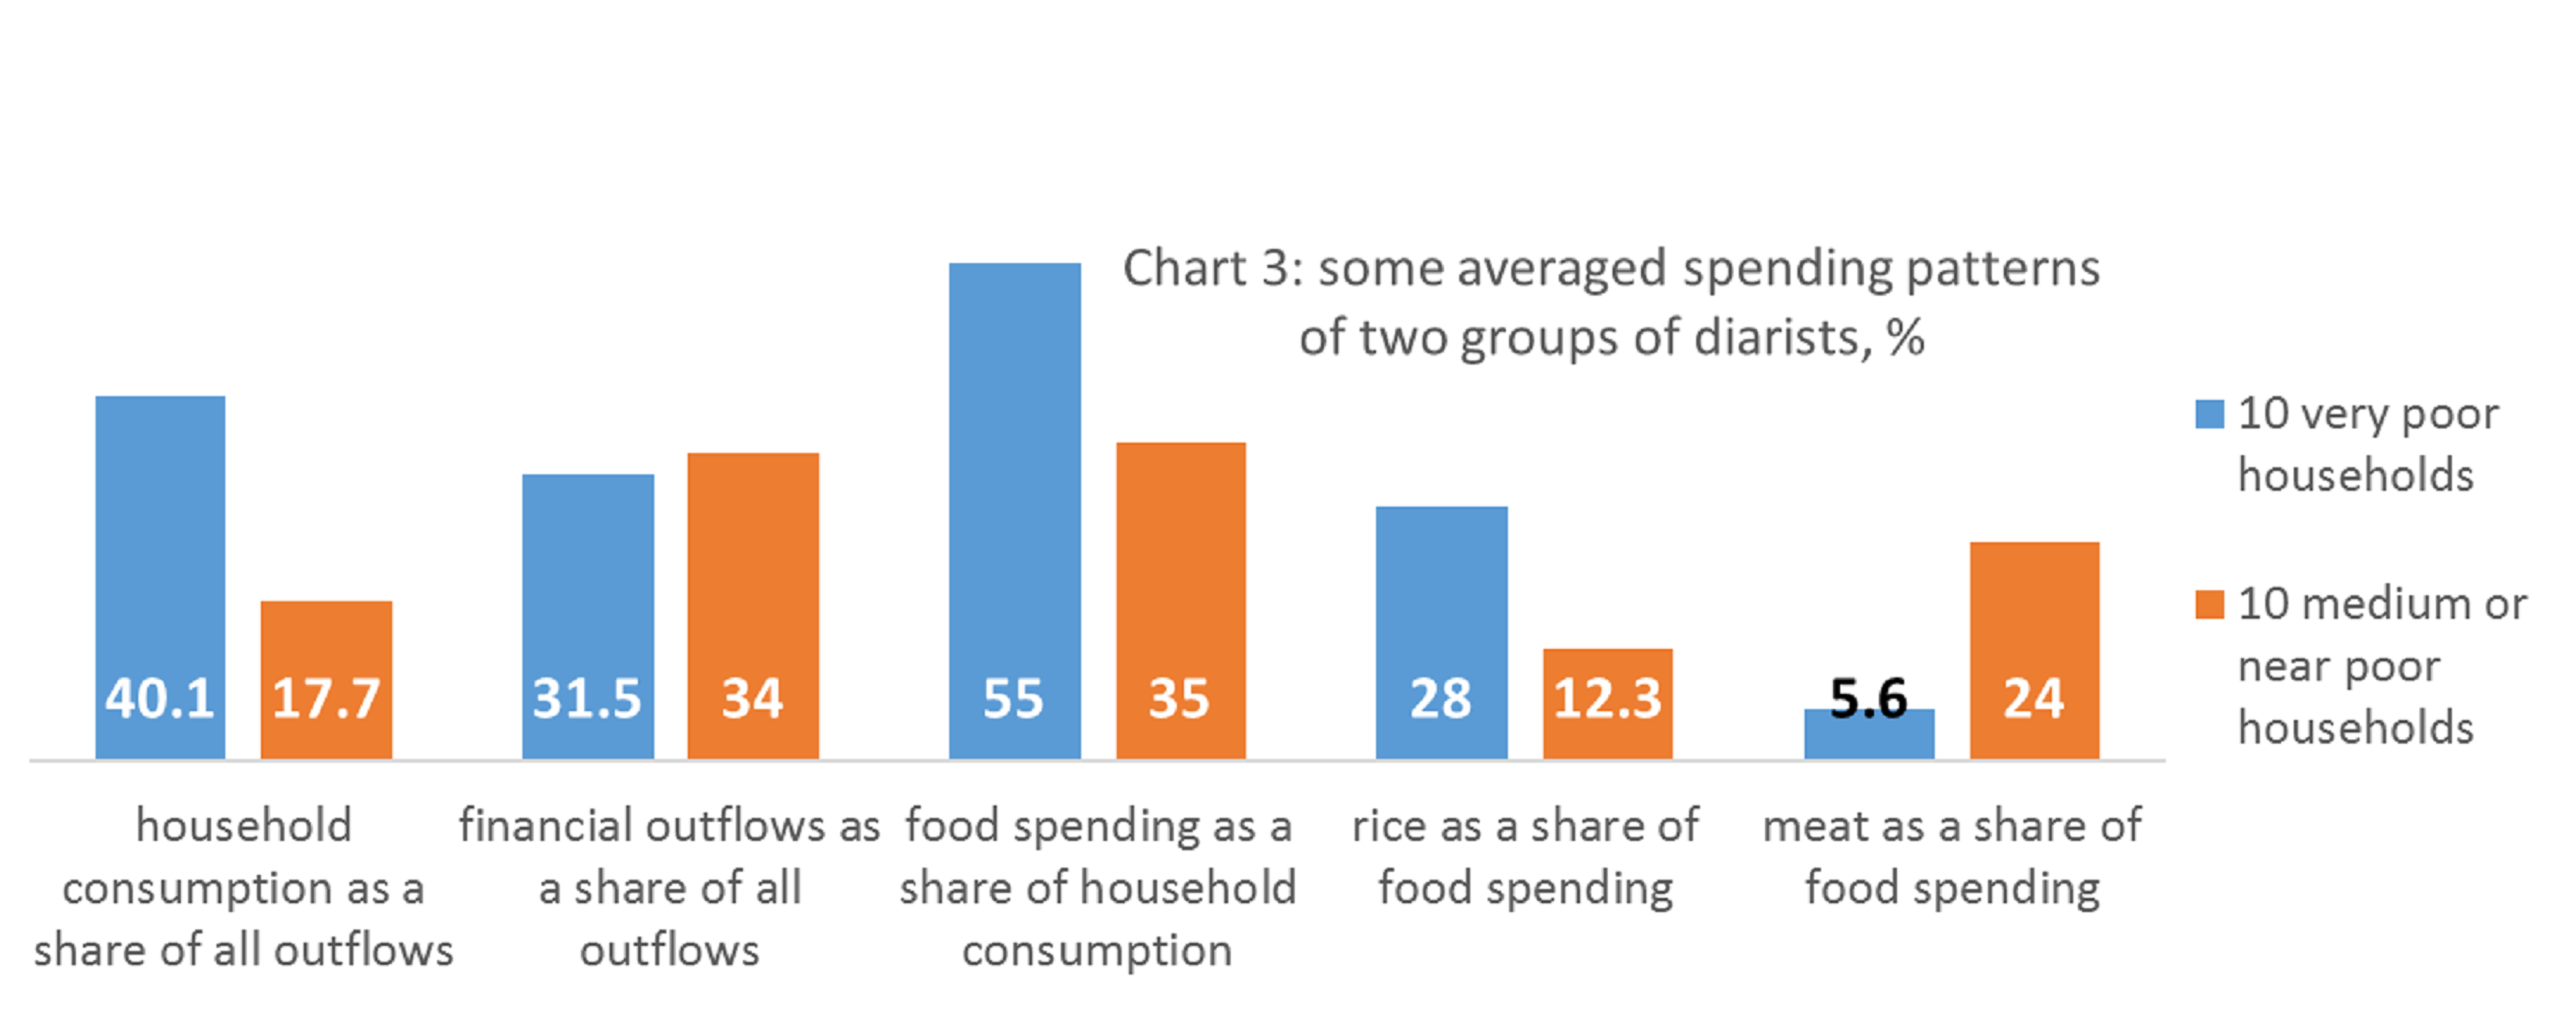
Turning to the ten wealthier non-farmers, we find that household consumption is only 17.7% of all outflows. For them, financial outflows account for a very large 34% of all outlays. Their spending on new home construction stands at 16.8%, well up on the diarists as a whole. Their food spending accounts for only 35% of household consumption, and within that sub-category fruits & vegetables (at 25%) and meat (at 24%) hold the tops spots, followed by fish (19.2%), with rice trailing at 12.3%. It is clear that these better-off households, compared to the poorest, spend a smaller part of their overall outflows on food but enjoy a more protein-rich diet.
We can also examine the value of food expenditure per person. To do that, we look at the six-month period from April to September 2016. In that time, the poorer 10 diarists spent PPP$102 per person on food (about $0.56 a day), whereas the wealthier spent PPP$172 (about $0.94 a day).
The numbers so far, though accurate, are averages. To avoid falling into the trap of assuming these averages represent real cases, we close with thumbnail sketches of two real individuals.
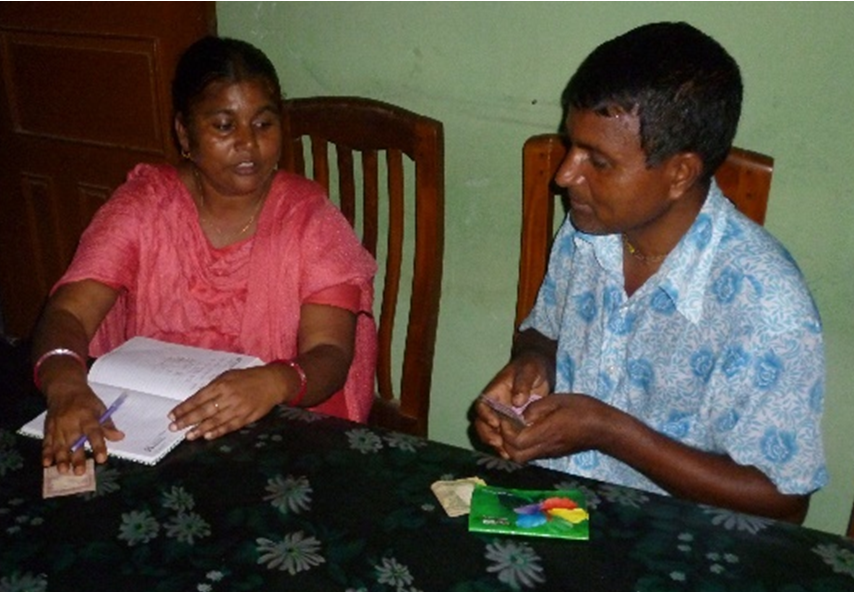
Karthik talking to our data collector
Karthik is a rickshaw puller, married with two school-aged children. He also earns money as a drummer in a band. Household income is about PPP$1.26 per person per day. Over a 470 day period he has given us 2,690 daily transaction records of his household’s expenditure, with a total value of PPP$4,183. The bulk of that (61.3%) went on household consumption, with a further 27.3% on financial outflows – mostly savings as he doesn’t borrow much. He has no big construction costs and he does almost all the buying for the household, transferring only a little pocket-money to his wife and children. But he has business expenses, at 7% of all outlays, because he has to repair his old rickshaw, and to pay rent to store it at night, as his home is so small there’s nowhere to keep it (there’s no room for a latrine either, so the family uses the next-door neighbour’s).
Looking at his household consumption, we find that the bulk, 68.4%, goes on food. After that comes kerosene for home cooking (6.5%), healthcare (5.3%, almost all of it simple medicines bought over-the-counter) and then the betel nuts, sweets and tea that he snacks on while working (4.1%: he doesn’t smoke or drink). Then about 5% each for transport, clothes, gifts (mainly religious), and education. Within the food category 38% goes directly on rice and a further 25% is used to repay shop credit frequently taken at the local grocery store (and certain to include yet more rice). 18% goes on fruits & vegetables, and 6% on fish (they are Hindus and do not eat meat).
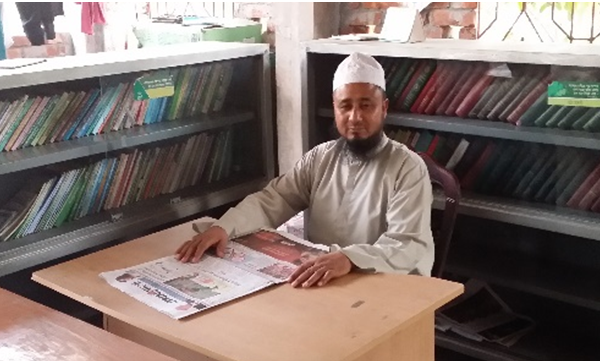
Mukhlesur in the library above his mosque
Mukhlesur is an Imam at a village mosque, and he too has a wife and two children at school. He gets a wage, supplements it with work as a tutor and librarian, and gets some gifts from his congregation. Total income is about PPP$3.24 per person per day. He has no business and no construction costs, and only 13% of his total outflows go to financial payments (all of them repayments of interest-free loans from family). 77% of all outflows go to household consumption, and within that food accounts for 52%, with 16% going for clothes, 11% for house rent, and 8% for betel and tea.
Within his food costs fish tops the list, at 28%, followed by fruits & vegetables at 26%. Only 15% goes on rice (though he also takes shop credit, probably including some rice). Meat, oil, and eggs-and-dairy come in at around 5% each.
If these details have whetted your appetite for more, you can get the data from me,
Stuart Rutherford, write.ser@gmail.com