By Stuart Rutherford, Honorary Research Fellow at The Global Development Institute
This is the fourth in a series of short articles about the findings of a daily ‘financial diary’ research project in Bangladesh. In this article, we look at the spending on health care of 48 of our ‘diarists’, using daily data for the 15-month period from 1st December 2015 to 28th February 2017.
How much did they spend?
Between them, our 48 diarists spent 491,524 Bangladeshi taka on healthcare in the period. At market exchange rates that’s about US$6,145, but at the more meaningful ‘PPP’ (purchasing power parity) rate, which makes allowances for the fact that things are cheaper in Bangladesh than in America, it is the equivalent of around $12,290, or $256 per diarist. Since the households that the diarists represent hold a total of 206 people, that’s a little under $60 a person, or $3.98 per month per person.
How much of a hole did that make in their finances?
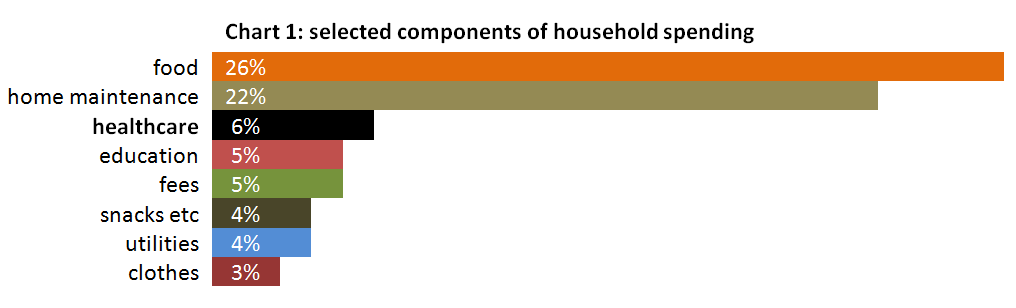
Our first chart compares spending on health care with some other big components of the ordinary household spending of the 48 diarists in the period, by which we mean all outflows except business costs (like buying stock for a shop), financial outflows (savings deposits and loan repayments), large investments in land and buildings, and transfers to other people in the same household. Healthcare takes up 6% of that spending, behind the 26% spent on food and the 22% spent on home maintenance, but ahead, for example, of education, utilities and clothes.
What did they spend it on?
There are many ways one might categorise health spending, but a useful one for this study is into three categories according to the value of each expenditure:
1 Large-scale spending on hospitalization and/or surgery. These are outlays of 5,000 taka (PPP$125) or more. There were only ten of them, but they comprise about 22% of the value of all health expenditure. These expenditures, of course, are the least evenly-divided between the 48 diarists.
2 Medium-scale spending, often on modern treatments, consultations, tests and medication. These comprise 81 expenditures of between 1,000 and 5,000 taka. They represent about a third of the value of all health expenditure.
3 Small-scale spending, on over-the-counter medication, or advice from pharmacists or faith-healers. These expenditures, of under 1,000 taka ($25) in value, are by far the most common: there were 1,400 of them. They comprise about 44% of the value of all health expenditure.
How often did they spend?
Using the numbers from the previous section, we can see that, on average, each of the 48 diarists made 31 expenditures, or about 2 a month. In terms of the total number of people in the study, that is about 7 expenditures per member of these households in the period, or about one expenditure every two months for each person.
Financing health care costs
No-one has health insurance, though some could conceivably benefit from charitable schemes run by the bigger MFIs. The public hospitals they use are subsidised, but almost all other outlays are to private for-profit providers. For the 10 large-scale Category 1 expenditures, money was assembled from cash-in-hand, savings, gifts from friends and family, and private and MFI loans, in some cases involving considerable stress. Category 2 and 3 costs came mainly from cash-in-hand and savings, or from taking ‘howlats’ (interest-free casual loans) from family friends and employers. Lenders are seen as an alternative to insurers: some diarists have told us they retain their MFI accounts partly because they believe they may need to borrow in an emergency such as a health scare.
Richer or poorer: does it make a difference?
To observe wealth-related differences in health care expenditure, we divide the 48 diarists into four ‘quartiles’ by per-capita income. Table 1 provides information.
Table 1: the four income quartiles values in PPP$
| Top quartile | 12 households with a per person per day income ranging from $4.13 to about $10. They may be described as moderately poor. |
| 2nd quartile | 12 households with a per person per day income ranging from $2.06 to $4.05. They may be described as very poor. |
| 3rd quartile | 12 households with a per person per day income ranging from $1.49 to $1.97. They fall below the Bangladesh ‘upper poverty line’. |
| Bottom quartile | 12 households with a per person per day income ranging from 73 cents to $1.44. These households are below the Bangladesh ‘lower poverty line’ and well within the World Bank ‘extreme poor’ category. |
Our second chart shows the health expenditures of these four quartiles.
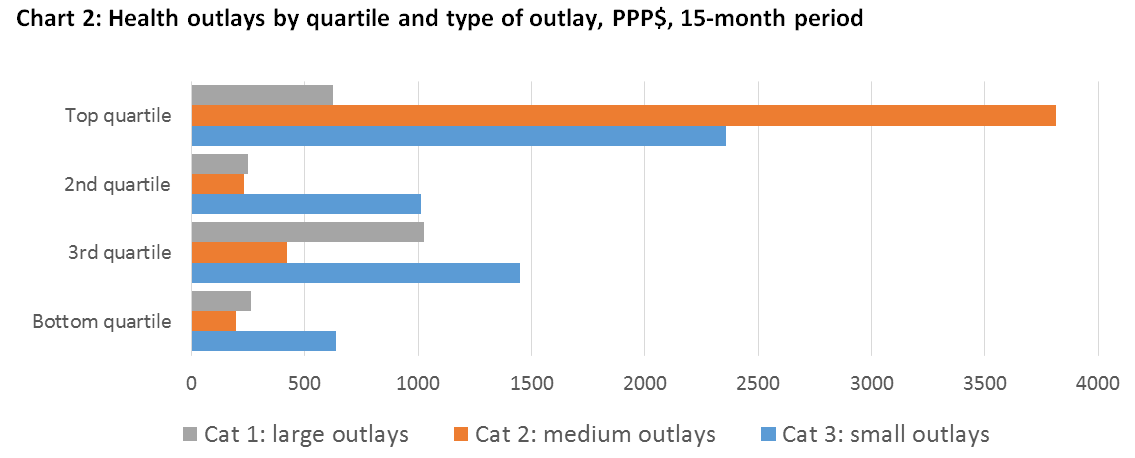
Chart 2 confirms what one might expect: the top quartile spent most and the poorest quartile spent least on healthcare. However, it also shows that the better-off top quartile diarists spend a much larger proportion of their health budgets on medium-cost services such as modern tests, treatments and drugs. This contrasts with the three remaining quartiles, who spend mostly on over-the-counter drugs and advice, and on traditional low-cost treatments – at least when they are not forced by misfortune to spend on hospitalization and surgery.
Of course, the top quartile diarists earn more than the others: to adjust for this, chart 3 shows expenditure adjusted by income-per-person for the quartiles rather than as absolute amounts.
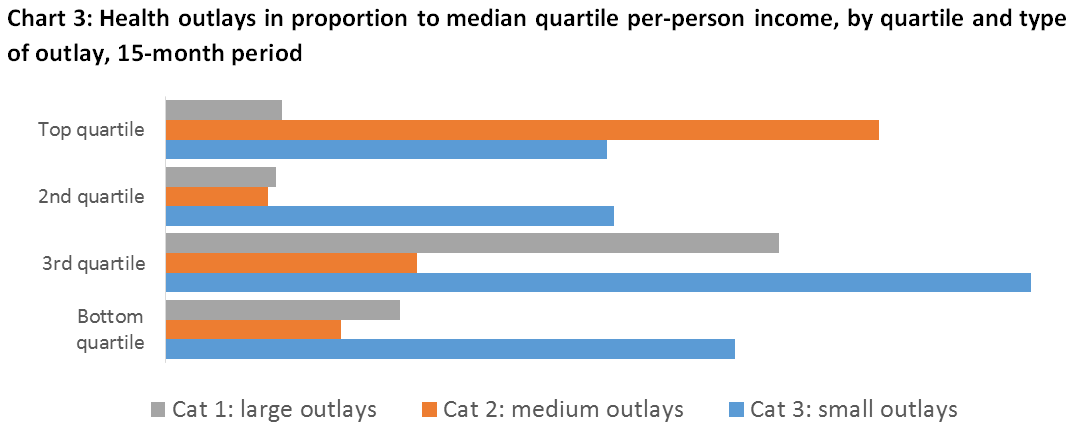
With health spending looked at relative to income, the differences between the quartiles is much less marked. What stands out, as in chart 2, is the difference in the pattern of spending.
 Some people behind the numbers
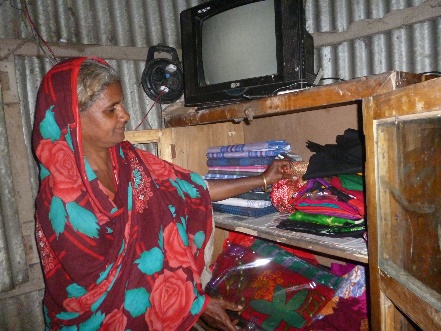
Jamilla is an energetic woman from a poor uneducated background who learnt how to buy and sell saris and has worked herself up into the top quartile of our diarists. With income at her disposal, she paid for her daughter to give birth to her first child in hospital, and in preparation for that bought various tests, injections, and medicines. Then, when she was trying to send her son abroad to work, she chose to have his medical tests done by a ‘good’ clinic in Dhaka, and paid $200 for them. These behaviours distinguish her from almost everyone in the lower quartiles.
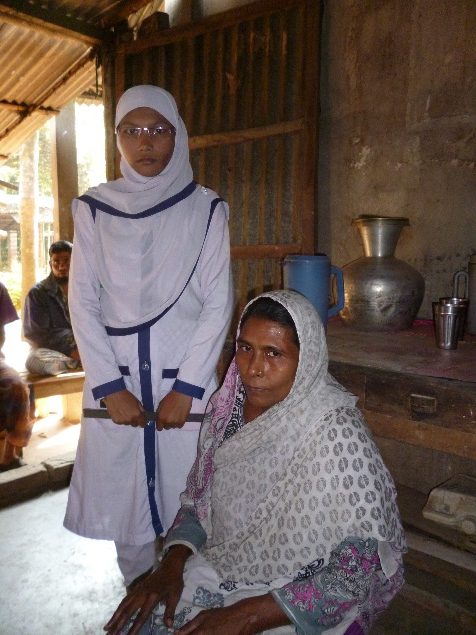 Sakhina and her husband, who is disabled following a stroke, run a tiny eatery and barely get by: they fall into our bottom quartile. When the oldest of their two daughters (pictured) suffered sudden-onset appendicitis, the couple had to pull together money from loans and gifts and savings to get her admitted to a local semi-charitable hospital where they paid $262 for the operation and more for drugs. It was a time of great tension.
Radha has the smallest per-person income of all our diarists, at 73 cents a day. She is a widow in her mid-50s who does odd-jobs for stallholders in the market, and often has aches and pains. Her total outlay on health for the 15 months, however, came to $1.88, and consisted of 13 separate purchases of over-the-counter painkillers at 12 cents each and one slighter larger purchase of ‘saline’ (anti-dehydration salts). If these pills don’t make her feel better, she simply stays at home and waits for the ailment to fade. She has a teenage daughter who sometimes stays with her and sometimes lives in a distant town where she is a sort of unpaid servant to better-off relatives. Radha dotes on her daughter and pines when she’s away: it is noticeable that when her daughter is with her, Radha’s medicine purchases almost entirely disappear.
In short
Our 48 diarists are from households that are, by recognised international standards based on income, extremely poor, poor and moderately poor. On average, they spend PPP$3.98 a month for health care for each of the 206 people in their households, and this outlay is, on average, about 6% of their total ordinary household expenditure. With no insurance, the health care is financed from their own resources, often including loans and gifts.
Notably, the health care expenditure pattern of the richest quartile of diarists is very different from the poorer diarists, in that they not only spend much more on health, but they are far more likely to spend on ‘modern’ services like diagnostic tests, advice and prescriptions. Poorer households rely more heavily on low-cost over-the-counter pills and advice, and on faith-healers and the like.