By Stuart Rutherford, Honorary Research Fellow at Global Development Institute
In an earlier article in this series about the findings of a daily ‘financial diary’ research project in Bangladesh, we looked at the spending patterns of households (“What do poor households spend their money on?”). Here, we zoom in on their biggest expenditures, using daily data for 40 ‘core’ diarists for the period from mid May 2015 to end July 2017.
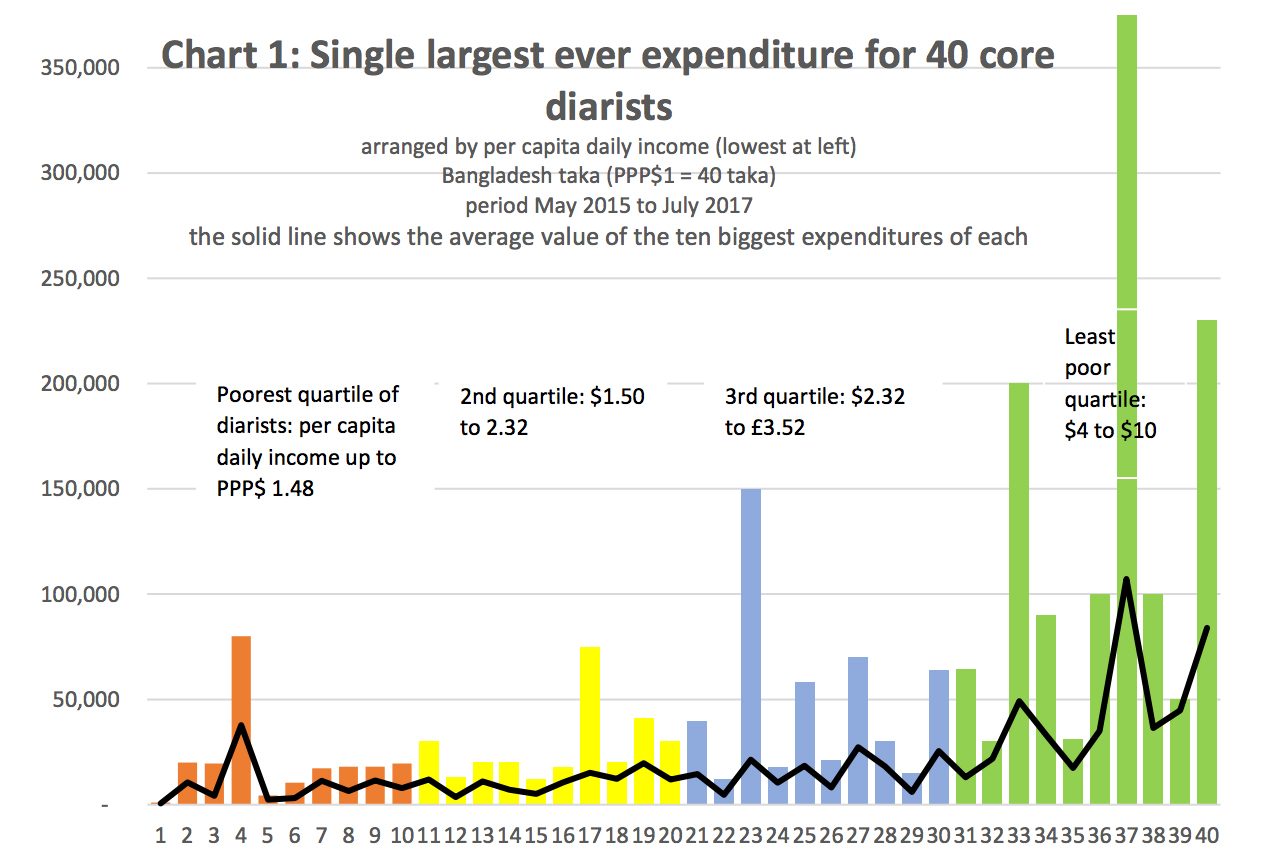
We begin with a chart that sets out, for each diarist, their single biggest expenditure during the whole of the time we have been tracking them.
As a way of checking how unusual these biggest-of-all expenditures are for the households, we show the average value of their ten biggest expenditures: in some cases (17, 23, 33 and 37 notably) we see that the biggest ever expenditure was several times bigger than other big expenditures they made.
Overall the chart shows what one would expect – the bigger expenditures are made by households with the bigger per capita incomes. Note though that the values for the poorest quartile of all (households 1 – 10) are similar to those of the next quartile up. At the extreme left of the chart we see an outlier – a household with a very low per capita income whose single biggest ever expenditure over a period of almost 27 months was just $27 (on over-the-counter medicine). By contrast, household 37 once made a single expenditure worth $9,625 (for migration costs).
In this post we will look at what these big sums were spent on, and the sources that funded them. A later post will add flesh to these statistical bones through case-studies. These findings should be of use to financial service providers and anyone interested in how poor people manage their money.
What were the big sums spent on?
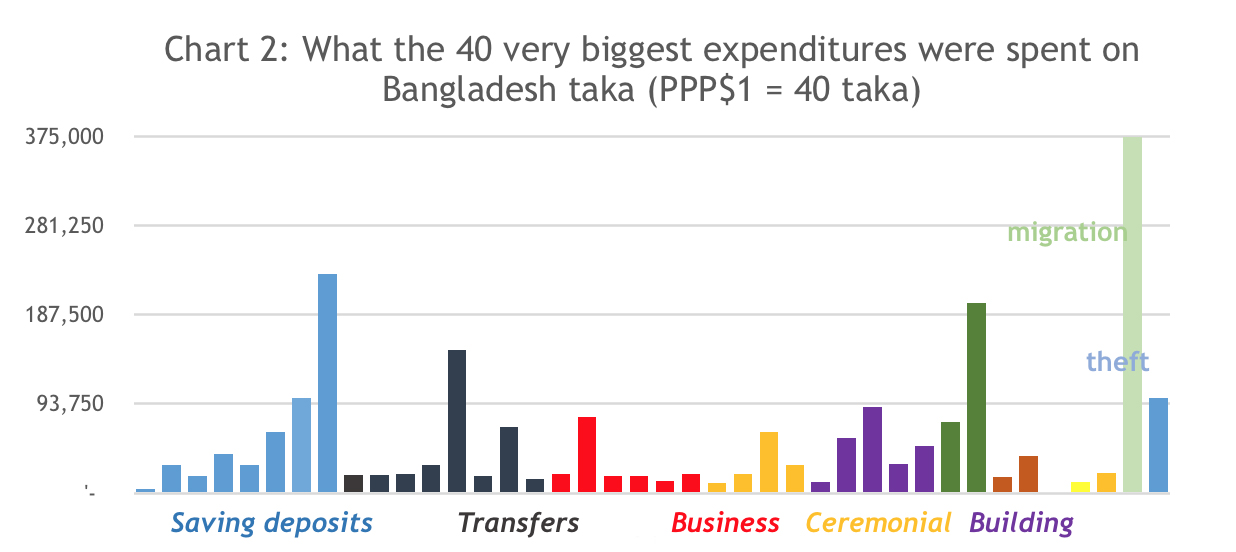
Chart 2 shows the uses to which our 40 core diarists put their single biggest expenditures.
Eight of these single biggest expenditures went to savings. Their value totalled 518,000 taka ($14,200), almost a quarter of all these biggest expenditures. Eight more were ‘transfers’ – diarists sending money back to their home villages, or lending money (interest-free) to other members of their immediate or wider family. Business use accounts for a further six expenditures, rather modest in value except for an investment in a lease on restaurant premises. ‘Ceremonial’ uses include buying jewellery that formed part of a dowry, buying cows for ritual slaughter at Eid (two cases), and family funeral expenses. Several households that enjoy overseas remittances devoted their biggest expenditures to building new homes. Two expenditures went on land purchases, including the third biggest of all. Other uses included loan repayment (in brown) health (yellow), and education (in gold, to put a son in college). The large expenditure of 385,000 taka (PPP$ 9,625) was to pay a middleman who arranged (unsuccessfully) to get a job for the diarist’s son in Malaysia. The final sum of 100,000 taka is anomalous – it was stolen from the home.
Chart 3 shows the uses made of each diarist’s ten biggest expenditures. This bigger sample of 400 expenditures is more representative of the way in which poor households spend their bigger sums.
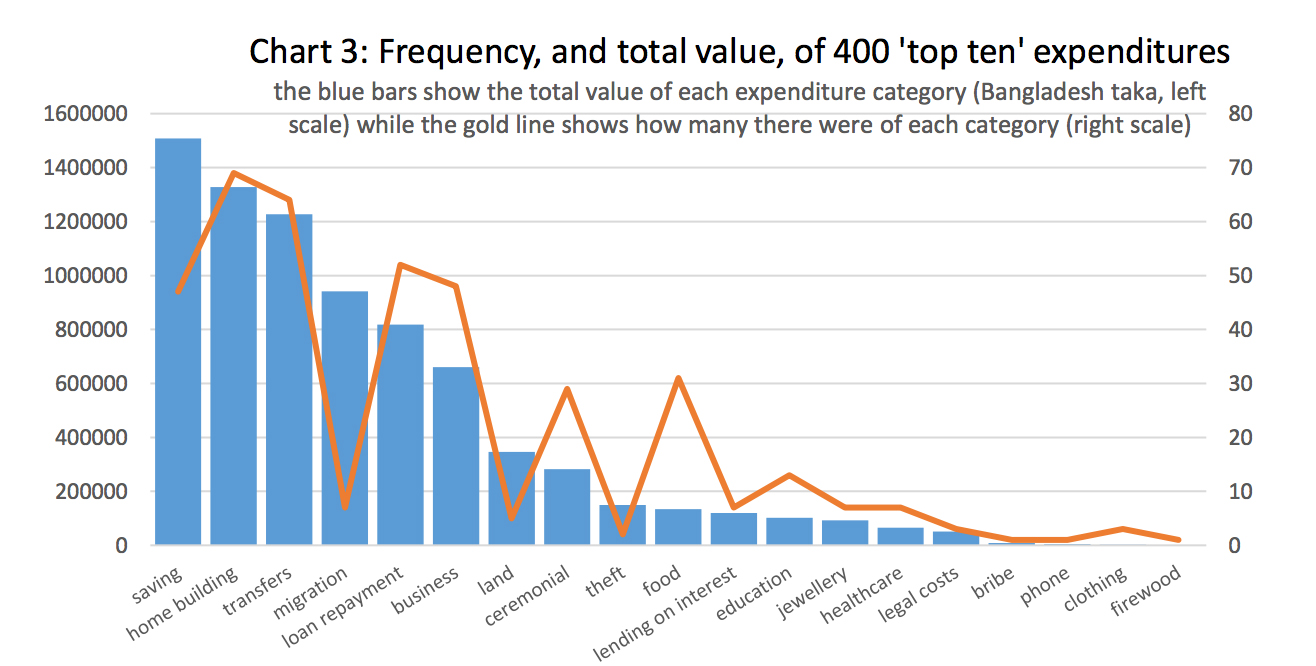
As in Chart 2, more money went to savings than to any other use, and it was the fourth most common way of using big expenditures. Savings-like behaviour can also be seen in the second most common category, transfers, which include many examples of sending money back to home villages, some of which is then saved. Home building – including construction, repair and furnishing – is both common and high-value: as we have seen, much of it is due to a small group of households investing their overseas remittances.
Note that for some categories a high total value (left scale) is combined with a low frequency (right scale), or vice-versa. Migration costs is one such case: the sums involved are large, though we recorded only 7 cases among our 400-strong sample. For other categories, notably food costs, the reverse is true: we saw more than 30 cases but their overall value is low. For some of the poorest households, it seems, buying food takes up not only a large part of their budget (see the earlier post in this series) but also features among their biggest single expenditures.
Business uses occupy a middle rank in both value and frequency. 26 of the 48 business expenditures were made by poor shopkeepers stocking their shops (saris, shoes, soft drinks, tobacco and recycling materials are the most common). Were we to include land purchase and leasing in the ‘business’ category its importance would rise. If business spending seems modest, is that a threat or an opportunity for loan providers like MFIs who see loan-fuelled business growth as an important goal? Why are more big sums saved than used in business?
How are these big expenditures financed?
When our diarists spend big, where does the money come from? Chart 4 shows the 400 ‘big expenditures’ arranged according to how they were financed, and grouped by the quartile that made them.
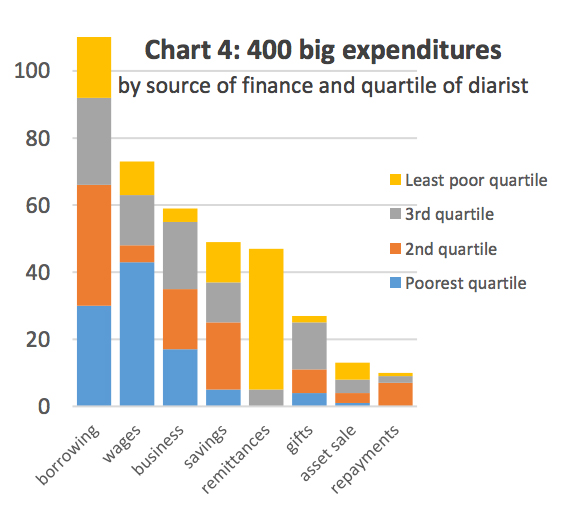
Here we see the importance of borrowing in the lives of these diarists: one fourth of all their big expenditures were financed by borrowing (from a wide variety of sources). Nevertheless, an even bigger number were financed directly from a combination of wage or business income and from savings: the poorest, in particular, tend to finance their big expenditures from their own wages more than from any other source. Not unexpectedly, the chart shows that the use of remittance money to finance big spending was almost exclusively the preserve of the least-poor diarists.
Our data also tell us about the role of MFIs in sourcing these big expenditures. MFI loans financed 59 of the 110 big expenditures that relied on borrowing. 51 were financed by informal loans, most of them interest-free: it is notable that with only one exception diarists from the poorest quartile did not take interest-bearing informal loans (‘moneylender’ loans) to finance their big expenditures. MFIs also feature strongly as homes for savings: 30 of the 49 expenditures financed from savings withdrawals came from MFI savings accounts.
We can also map the uses of the big expenditures against their financing source, to answer the question, ‘are there preferred sources for the various categories of use?’ For this we take the 6 most frequent use categories shown in chart 3 and the 8 main source categories used in chart 4.
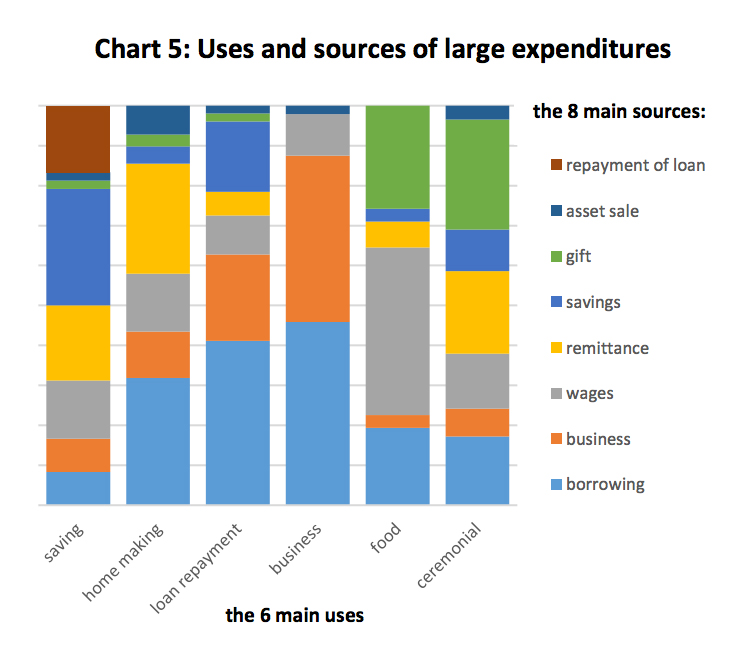 The most obvious ‘match’ between uses and sources is in the funding of big business costs, where borrowing and re-investment from the business itself dominate. Big loan repayments – perhaps worryingly for MFIs – are more commonly funded by borrowing than by business income. Savings are made from all sources (including other savings, as diarists move their savings around). Gifts are found funding ceremonies and – among the poorest quartile especially – big food expenditures, though wages are the source of most big food expenditures. Remittances most often go to fund home-making, ceremonies, and savings. When our diarists receive repayments on loans they have made, they seem to prefer to save them. Assets may be sold to fund home-making, ceremonies, loan repayments and businesses.
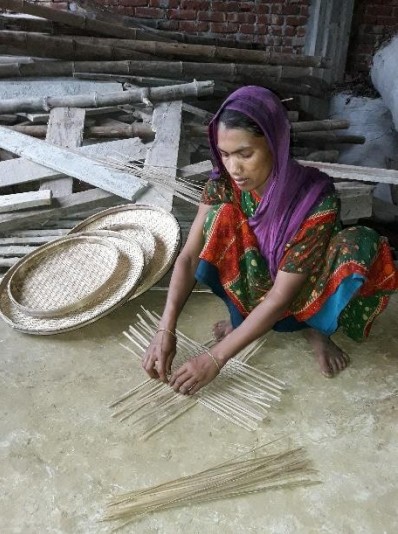
A very small business
Conclusions
We have been looking for patterns in how our diarists cope with their biggest expenditures – and we have found some. But the data also show a great deal of variation in the behaviour of our diarists, whether taken as individuals, or as people with similar occupations or similar income levels. This diversity will be explored through case-studies in a forthcoming post.
For the period 2017-2019 the Financial Diaries Project is receiving support from UNCDF’s Shaping Inclusive Finance Transformation (SHIFT) Programme.
Read more analysis based on the Hrishipara Diaries:
- How are Digital Financial Services used by poor people in Bangladesh?
- What the poor spend on health care?
- How the poor borrow?
- What do poor households spend their money on?
- Tracking the savings of poor households