The story so far
These blogs offer a running commentary on how 60 low-income households in central Bangladesh who volunteer as ‘diarists’ in our daily financial diary project have coped with the pandemic. The first blog in this series was written just after a ‘corona lockdown’ was enforced in Bangladesh on 26th March 2020. The second showed how bad things got during April, the first full month under lockdown. The third reviewed the partial recovery that took place in May. The fourth blog covered June, the first month after the lockdown ended. This fifth blog is about July, when Bangladesh was hit by heavy flooding as well as the continuing pandemic.
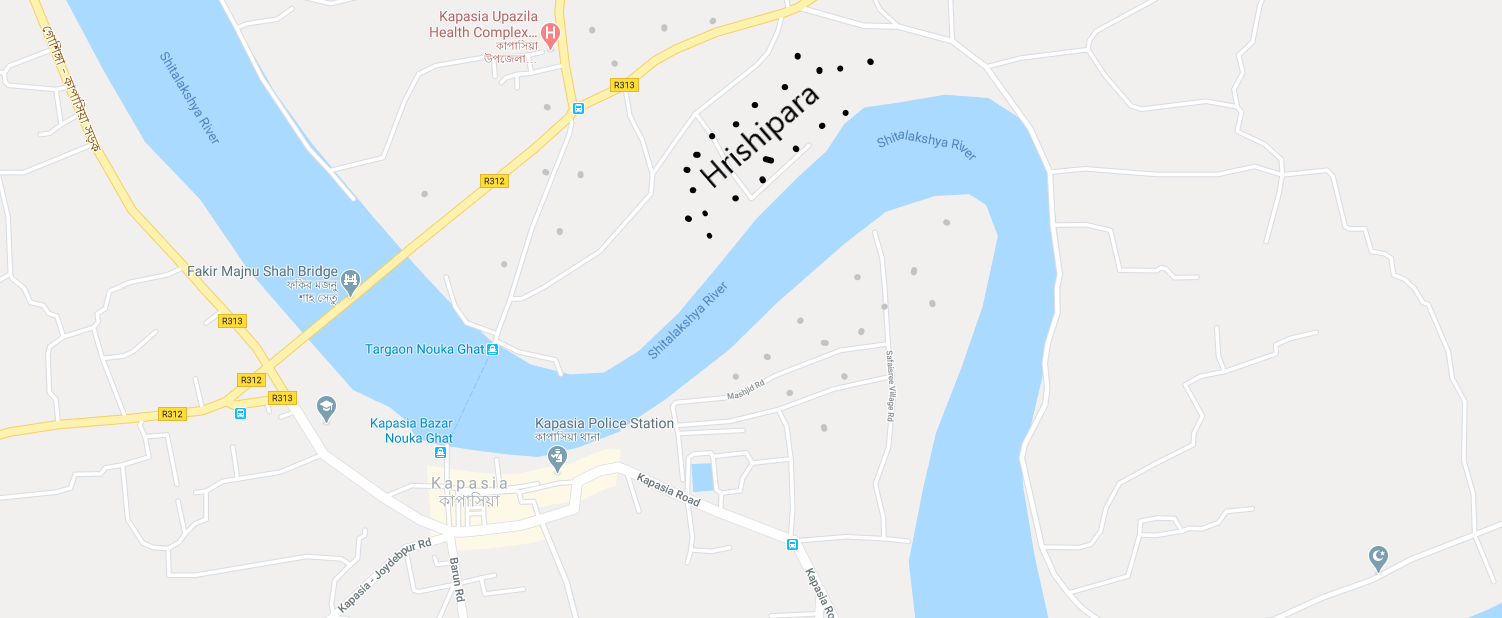
Hrishipara, the Hindu neighbourhood where our office lies and a good number of our diarists live, lies on the north bank of the Shitalakshya River, a tributary of the Ganges. As the photograph shows, in July its waters found their way into the village. Other diarists live on the south bank, in a mixed Hindu/Muslim community to the east of the main Kapasia market. Yet others, mostly Muslim, live north of Hrishipara, labouring, running shops in the Torgaon market, or farming the land.
Double jeopardy…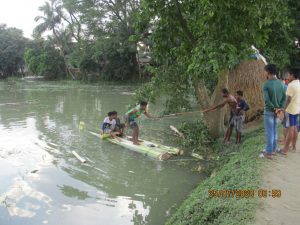

Every year in the monsoon season the Shitalakshya River floods and fertilises its low-lying shores where Hrishipara folk grow vegetables and bananas and graze their cattle. This July the water has risen well above normal levels, destroying rather than sustaining the crops, and seeping into homes. Flooding on this scale was last seen in 2002, the year we first came to the area.
Despite the inconvenience, the damage, and the loss of income that it causes, the flooding is a well-understood phenomenon that will go away within a few weeks. Moreover, it is visible. That makes it unlike the coronavirus, the other rising disaster confronting our diarists.
There is little reliable data about the virus in the area. Nationally, say official figures, infections have grown by 100,000 during July (to almost 250,000), and deaths by 1,300 (to 3,200), but these numbers are based on very few tests and a weak reporting system. Our District, Gazipur, has not featured recently in the government’s daily lists of the whereabouts of new infections, and other than a hospital worker and his wife who contracted Covid-19 in April, and recovered, none of our diarists has been tested nor has died. But a local newspaper asserts, on unknown evidence, that there are at least 700 current cases in and around Kapasia Market. The formal health system has broken down and no-one seeks its help. In place of information, we have rumours about infections and deaths and a widely-shared set of beliefs about how fellow-citizens are behaving. People are thought to be hiding the merest hint of the disease, fearing that revealing it will bring rough treatment and isolation from their neighbours, and worsen the already weakened chances of getting work.
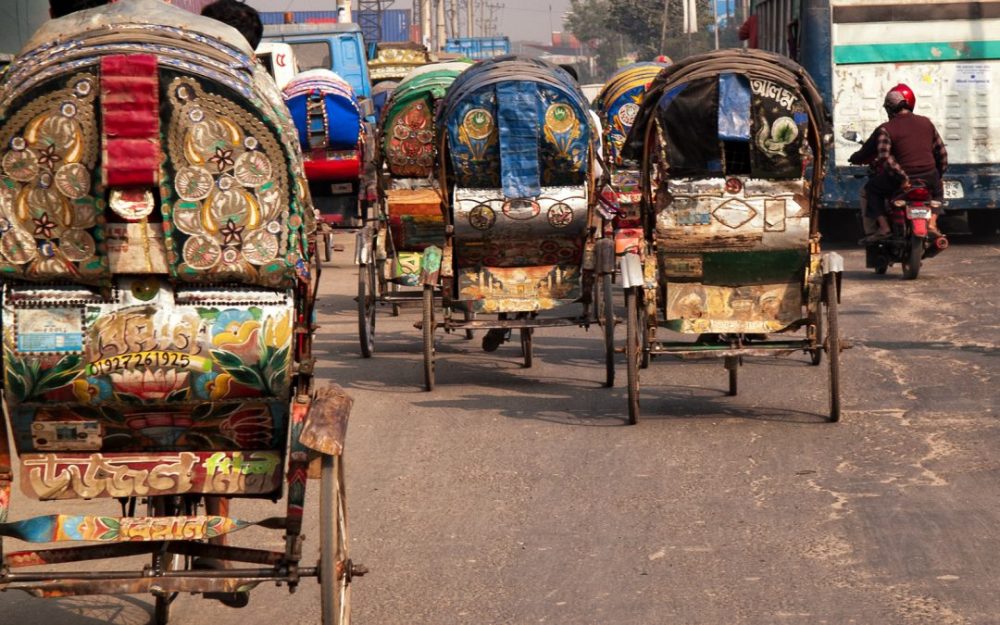
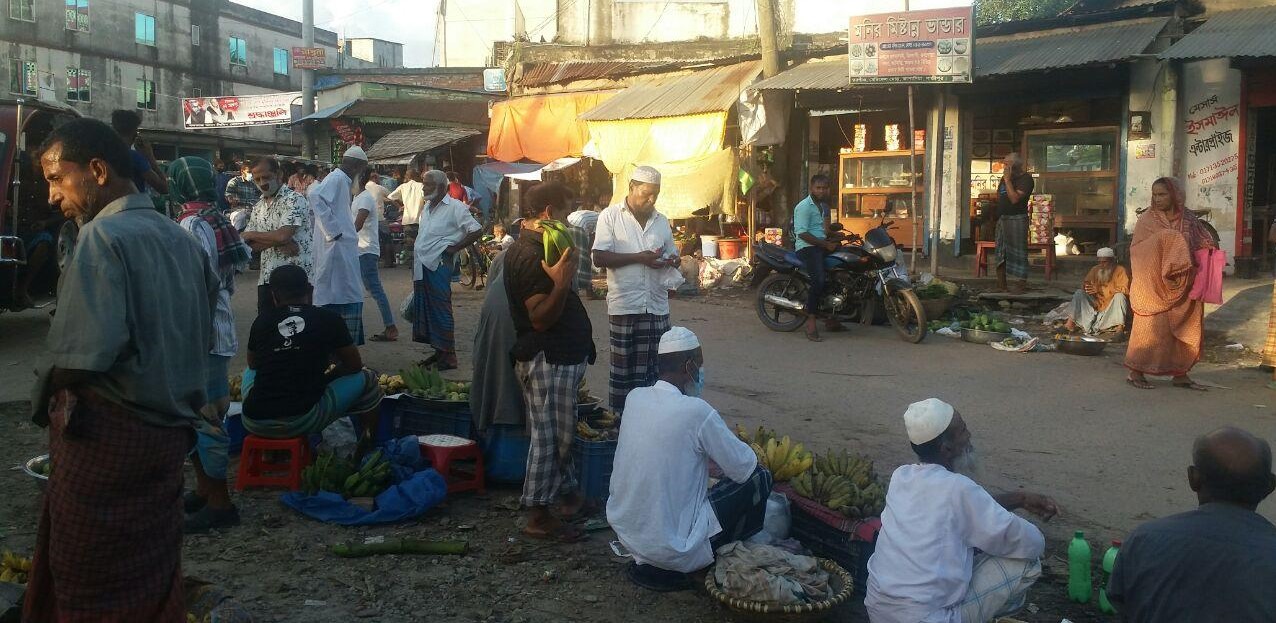
… but the markets are crowded again
Our diarists tell us that “What was strange and frightening in April seems normal now. We can’t stay at home as we have to work to eat”. The barriers that the young men of Hrishipara put up in April to stop people entering the neighbourhood have been taken down. So, despite this gloomy background, the local markets now look as crowded as they did before the outbreak. To better understand this, we present some key aspects of our diarists’ transactions.
A sharp spending revival
Chart 1 looks at the extent to which household spending has recovered, by comparing the monthly totals for the Covid-19-affected months with averages for earlier months.
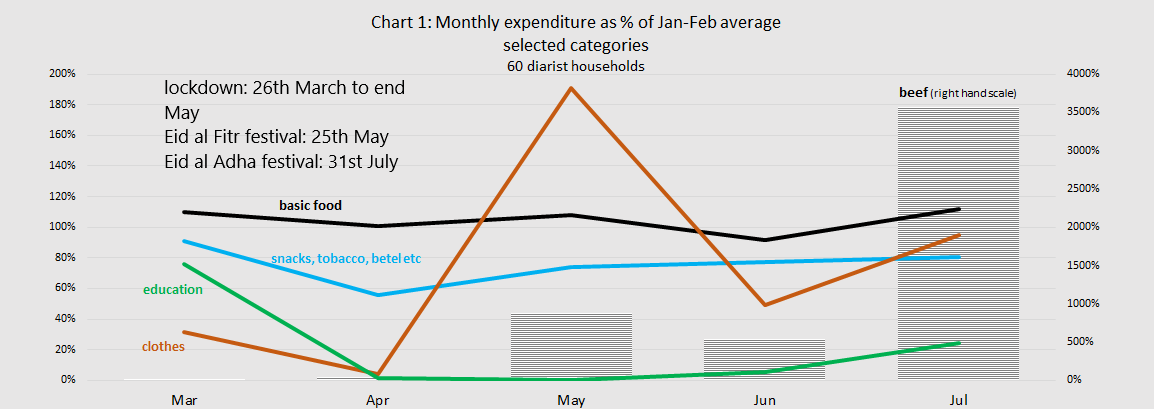
As we noted in earlier blogs, by tightening their belts and focusing on essentials, our diarists maintained their consumption of basic food: in July it was running at 112% of the pre-Covid-19 months. The consumption of beef (a luxury eaten by Muslims only) had fallen away sharply but responded massively to the Eid al Adha festival which fell on the last day of July. During that month more was spent on cows for sacrifice (319,500 taka, about $3,750 at market exchange rate) than was spent on basic food.
The consumption of snacks and stimulants, and spending in the many tea-stalls, fell back when the lock-down started on March 26th but has revived steadily since then, reaching 81% of pre-Covid-19 levels in July. Spending on education and on clothes entirely disappeared in April but clothing bounced back for the Eid al Fitr festival which occurred on May 25th: it fell back after that but has revived in July. Education spending has remained near zero, as the schools are still closed and are set to remain so until the end of August. Some tertiary-level students paid fees in July for online tuition, exam-fees, and advances on future hostel fees that the desperate colleges are pressing them for.
Chart 1 makes two things especially clear: the influence of the Islamic religious calendar on spending continues despite Covid-19 (even though only 60% our diarists are Muslims); and the availability of spending money in July. To understand the source of the spending power, we need first to look at what has happened to income (Chart 2).
The remittance mystery
Chart 2 shows how the combined incomes of our diarists swelled to the equivalent of $11,164 in July, dwarfing the $2,370 they earned in April, just after the lockdown came into force, and comfortably exceeding the pre-Covid-19 levels of January and February.
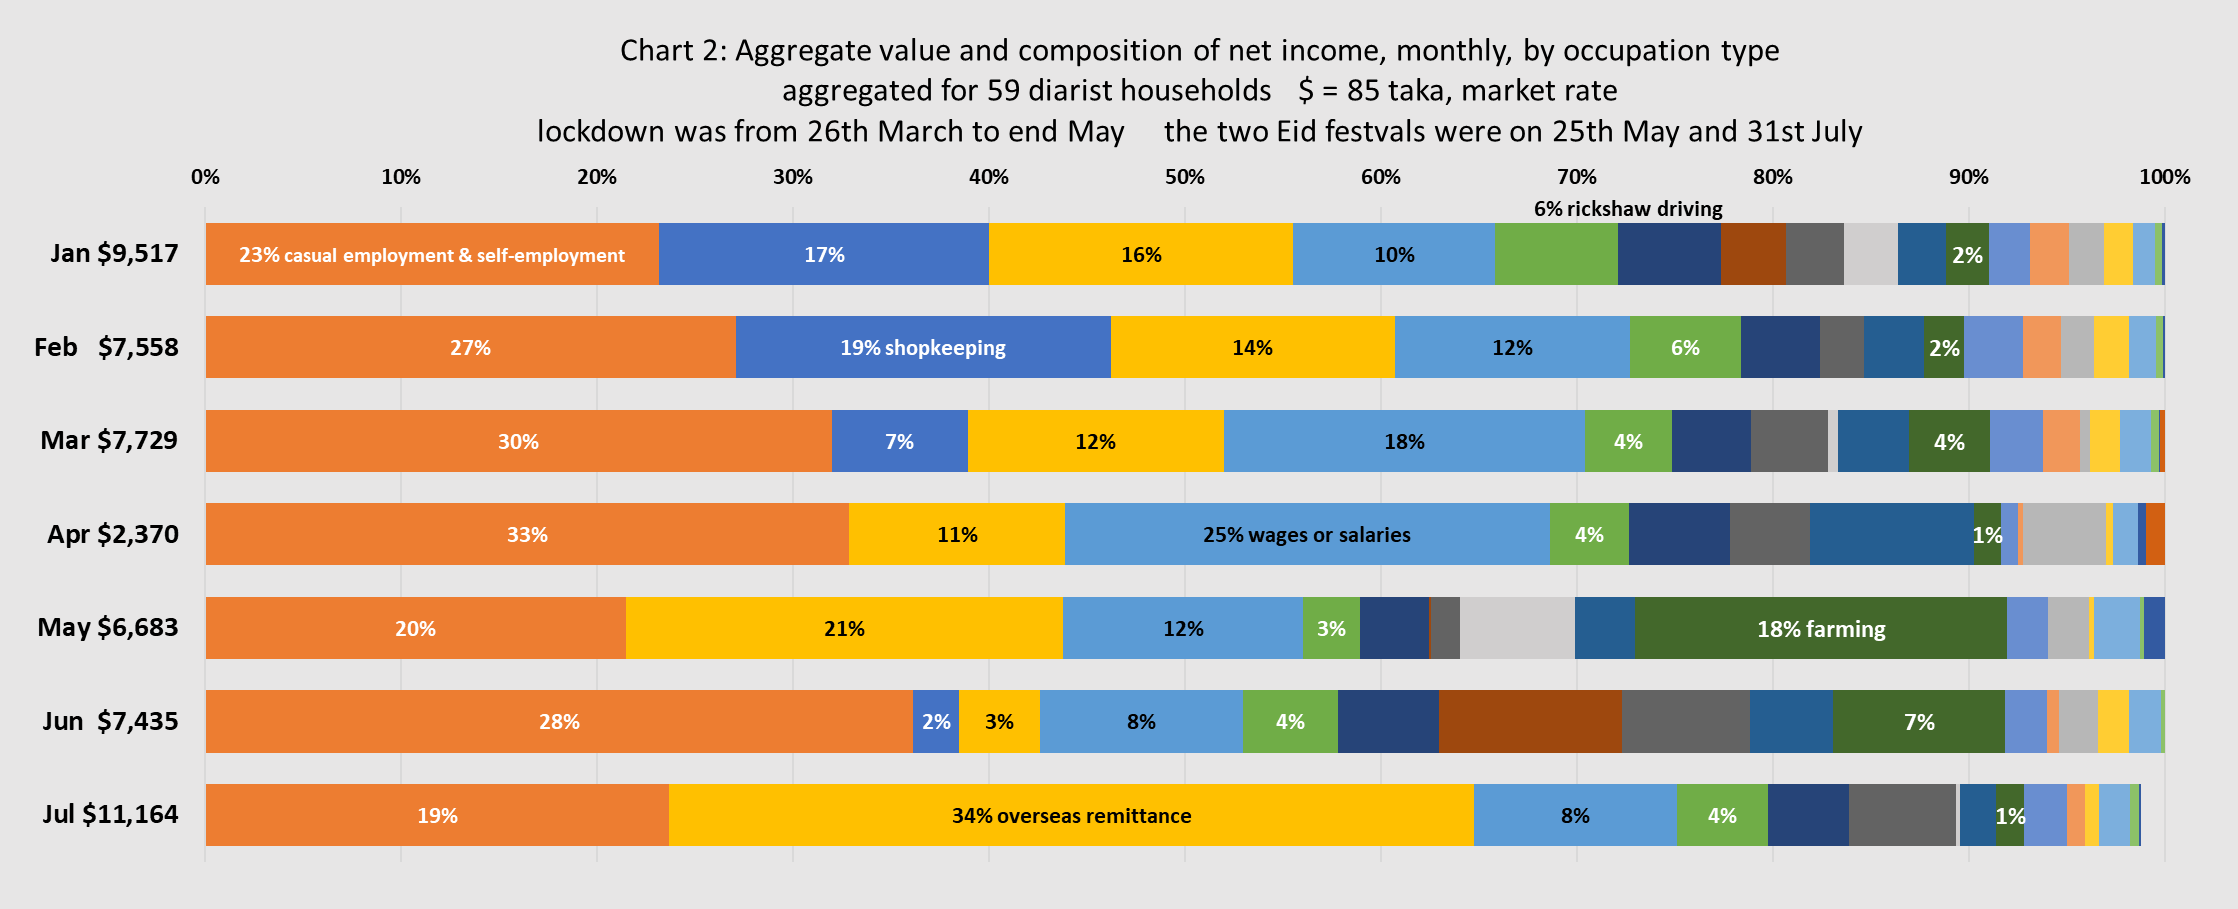
But which of our diarists enjoyed this remarkable turnaround? By showing the share of income going to the various occupations of our diarists, the Chart points to overseas remittances.
The behaviour of overseas remittances has been one of the big surprises of the Covid-19 story. Before Covid-19 they ran at around 15% of all income, and recipient diarists had hoped that their spouses and children abroad would support them during the lockdown. In fact, many of those overseas earners were also locked out of their jobs, and rather than rising, remittances fell to an 11% share of a much smaller pot of incomes in April. Their recovery in May was a pleasant surprise that allowed recipients to enjoy Eid al Fitr. But in June came another pause, and analysts, such as those at the Asian Development Bank (ADB) believed that Bangladesh would be among the biggest losers in an international remittance slump. But according to news reports, figures from the Bangladesh Central Bank show that the country’s remittance income in July was 62% bigger than in July 2019 and 42% bigger than June 2020. Our sample echoes this turn-around.
Just in time
Rubi’s husband is disabled and unable to work, but their son has been in Singapore for some years, as a construction worker. Three years ago the son came back briefly to get married, since when he has sent remittances to both his own and his wife’s family. The sums are still substantial. In the five years, we have been recording Rubi’s transactions he has sent them 1.3 million taka, or about $16,000 at the market exchange rate. He made a habit of sending the money every month (usually by the informal hawala system, known in Bangladesh as hundi). In January this year he sent 20,000 taka. But when Covid-19 struck Singapore he was ‘furloughed’ – he got food and accommodation but no wage, and his remittances stopped. Rubi was embarrassed: she had agreed with a neighbour to share the purchase of a cow for slaughter and desperately wanted to pay up before Eid. Happily, the son was re-employed and on 28th July, just three days before Eid, 70,000 taka came, this time via a mobile-money service. On 30th July Rubi paid 23,000 taka for her share of the cow. The next day Rubi’s family, which includes a married daughter and son-in-law, enjoyed the festival in the new brick-and-concrete home that they have been building with the remittances.
Tough times for shopkeepers, good times for salaried workers, and a mixed picture for others
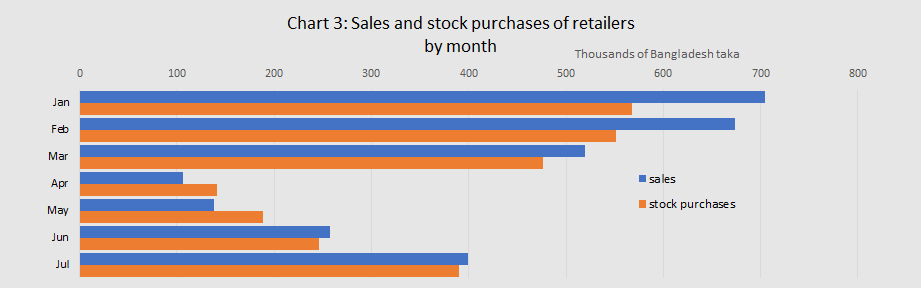
Chart 2 has shown that retail, which before Covid-19 was responsible for an 18% share of all diarist income, disappeared from the chart in the difficult months of April and May. This is not because they stopped selling altogether – though sales were extremely low in those months – but because they spent more on stock than they earned on sales. They normally work on a day-to-day basis, using today’s sales to buy tomorrow’s stock. The collapse in sales in April, when police and army patrolled during the day and they had to open their shops surreptitiously, threw them out of their normal rhythm. Sales have now recovered somewhat, but their profit margin has not, as seen in Chart 3.
Diarist households with permanent employment with reliable employers – especially government – have kept earning throughout the pandemic. Their share of income, normally running at around 10%, consequently swelled to 25% in April, the hardest month. It has since fallen again as remittances revived (Chart 2 again).
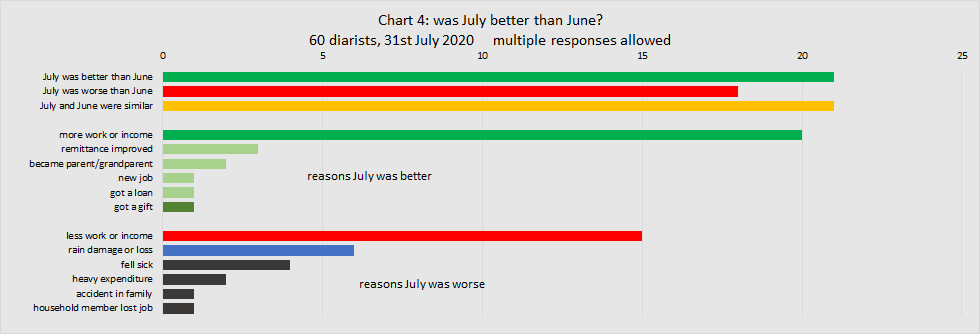
The majority of our diarist households make their living from casual employment (in the fields, in the market, on construction sites, on buses, and in shops) or from low-skilled self-employment (as rickshaw drivers, boatmen, vendors and craftspeople). We saw in Chart 2 that, as a group, their incomes fluctuated, dropping sharply in absolute terms in April but generally holding up as a share of total incomes. As individuals, their fortunes varied. We can get a glimpse of this through our regular monthly survey where we ask each of our diarists how the current month compares to the previous month. The outcome of the survey asking them to compare July to June can be seen in Chart 4, where out of 60 diarists, 20 reported improved earnings in July while 15 reported reduced earnings.
Did financial services help?
In Chart 5 we look at the absolute values of the monthly incomes shown in Chart 2 and compare them with other inflows that the diarists enjoyed – those from gifts, and those from financial services (of all kinds, including banks, co-ops and MFIs, and informal sources).
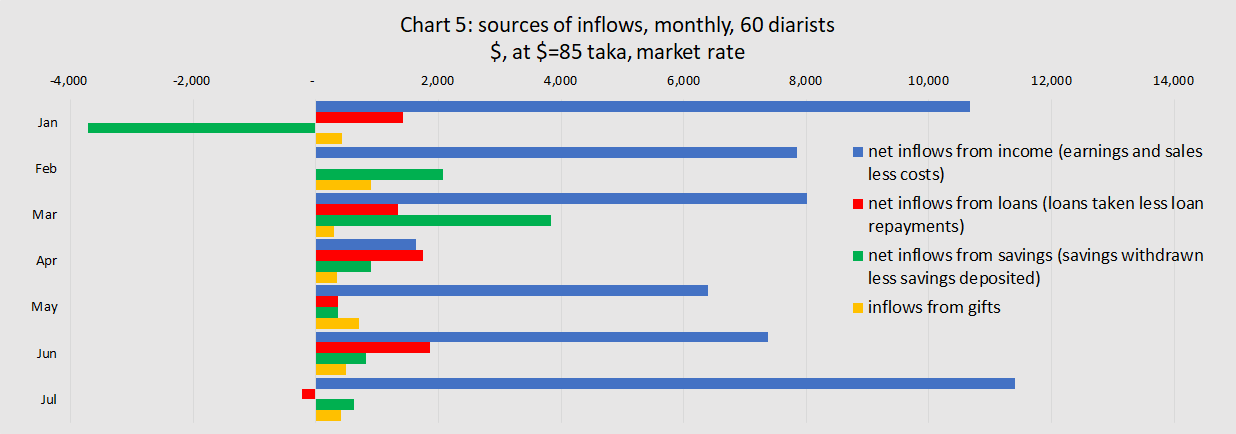
The contribution to inflows made by the receipt of cash gifts was small, especially in the most difficult month of April (though there were also some gifts in kind).
For those interested in the utility (not just the sustainability) of finance for the poor, the results for savings and loans may at first glance look disappointing, because the chart makes clear that they didn’t put much money into the hands of our diarists. There were small, negative, or negligible net inflows throughout the period. Overwhelmingly, spending money still came from income.
In part, this was because the MFIs, which is where most of our diarists do most of their borrowing and saving, were closed from the onset of the lockdown in late March until early June. But this supply constraint was only one side of the story. We noticed that our diarists were not complaining much about the MFI closure, and know that from our conversations with them that although in a few cases this was because they liked not having to make their loan repayments, in many other cases it was because, in the light of all the uncertainty surrounding Covid-19, they wanted to keep their savings as an absolute last resort. Some even said they were glad they couldn’t take their savings, preferring to cut back on current spending.
We need to dig a little deeper. Although Chart 5 accurately shows the net contribution to available cash made by savings and loans, it doesn’t reveal the gross numbers behind this outcome, and in so doing it underplays the importance of savings and loans in the transactions of our diarists. As a corrective, we show the gross numbers in Table 1 and present them in Chart 6 in a format comparable to Chart 5.
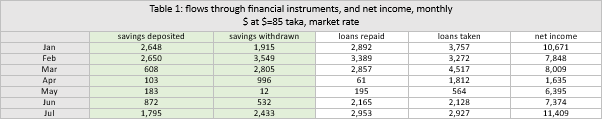
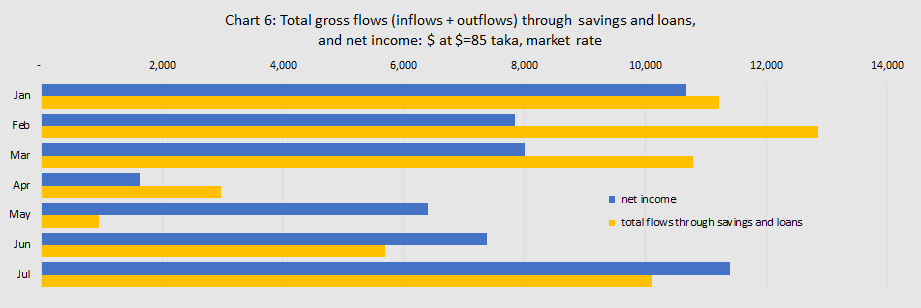
Chart 5 shows July’s net inflow from loans as a very small negative figure, but a glance at Table 1 and Chart 6 shows that in fact, diarists were busy paying off their loans and taking new ones, as the MFIs started to come on stream again. Similarly, diarists were depositing and withdrawing savings in July in volumes comparable to pre-Covid-19 days. That all this activity resulted in only small additions to their disposable resources suggests that, even in the depths of the Covid-19 crisis, diarists were managing their saving and borrowing more for future than for present gain.
You may be surprised that households are pushing and pulling more money through savings and loans each month than they earn in a month. It is not just an oddity of this strange Covid-19 year. It has been true throughout the diary study, and is one of the striking findings from the diaries. In the 62 months that the study has been running, there have been only 11 months in which income transactions totalled more than financial transactions. In 2019, it happened only twice, in January and July. In all, we have recorded 54.3 million taka of net income transactions and 96.4 million taka of savings and loan transactions.
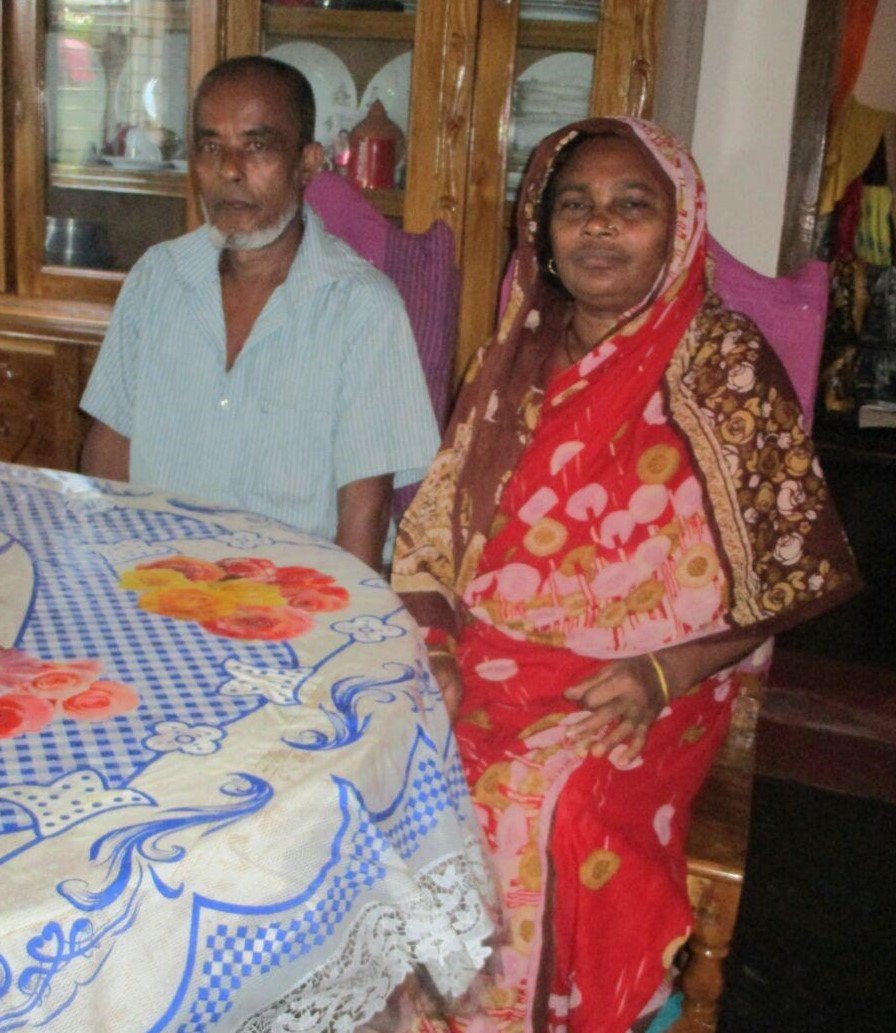
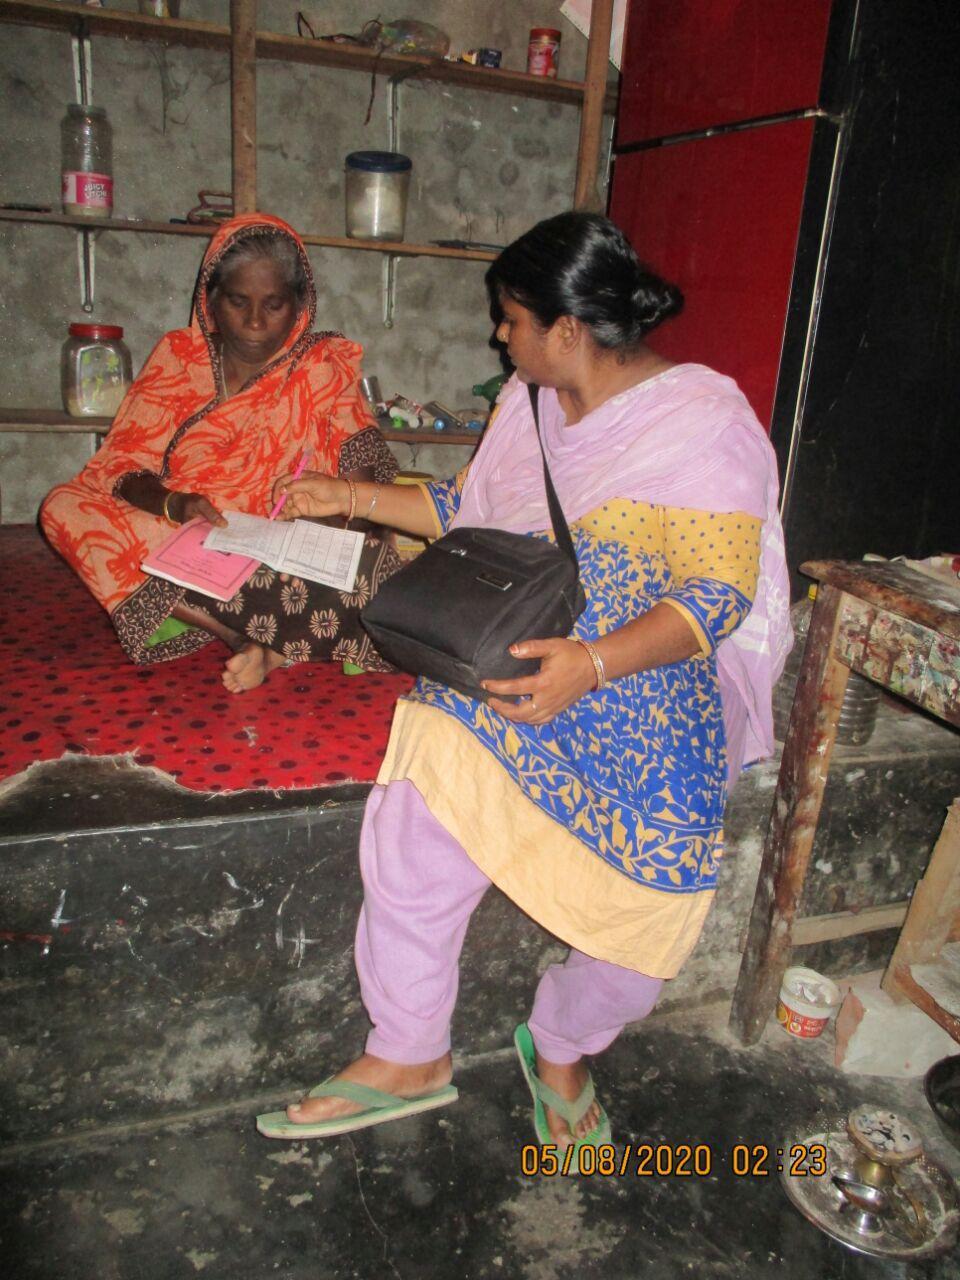 Some of the financial transactions, of course, are transfers from one account to another. Even ignoring them, financial transactions have still been larger than income transactions. And many of the transfers are not mere banking routine but are thoughtful acts of money management. Sajina, for example (seen in the picture with Shobha, our senior data collector), runs a small village shop which she inherited from her recently deceased husband. She has been quietly reorganising the financial arrangement he left her. She recently moved some of her savings from a higher-interest open-access savings account to a lower-interest account that places restrictions on withdrawals. She displayed this ‘illiquidity preference’, as it has been called, to safeguard the deposit against the temptation to withdraw it. These are uncertain times, she said, but the future is always before us.
Her comment echoes the prevailing mood of our diarists as they move into another month of the crisis.
Stuart Rutherford
August 4th 2020
 All fieldwork for the Hrishipara Daily Diaries Project is now being funded by L-IFT. We gratefully acknowledge their invaluable support.
Read more analysis based on the Hrishipara Diaries:
- Low-income households in Bangladesh give as well as take loans
- Education and Occupations
- How are Digital Financial Services used by poor people in Bangladesh?
- What the poor spend on health care?
- How the poor borrow?
- What do poor households spend their money on?
- Tracking the savings of poor households
- When poor households spend big
- When poor households spend big part 2
- Poverty measurement using data from the Hrishipara daily financial diaries
- Receiving Gifts in Low-Income Households
Note: This article gives the views of the author/academic featured and does not represent the views of the Global Development Institute as a whole.